
The Limits to Growth

Cat: SCI
Pub:
1972
#: 0219b
Donella H. Meadows, Denis L. Meadows, etc.
02531u/18130r
Title
The Limits to Growth
成長の限界
Author
Donella H. Meadows, Dennis L. Meadows, etc.
D. H. メドウズ他
Published
1972
1972年
Index
Why?
- It is fresh and worth for reading again the report of The Club
of Rome, after the experience of collapse of bubble economy in 1990s
and deflation spiral situation in 2002-03.
- ローマクラブの報告書を、1990年代のバブル経済の崩壊と2002-03年のデフレ・スパイラルの経験を経て再読することは新鮮であり役にたつ。
Summary
要約
>Top 0. Introduction:
- The Club of Rome:
A group of 30 individuals from 10 countries gathered in the Accademia
dei Lincei in Rome concluded:
- If the present growth trends in world population, industrialization,
pollution, food production, and resource depletion continue
unchanged, the limits to growth on this planet will be reached
sometime within the next 100 years. The most probable result
will be a rather sudden and uncontrollable decline in both population
and industrial capacity.
- it is possible to alter these growth trends and to establish
a condition of ecological and economic stability that is sustainable
far into the future. The state of global equilibrium could be
designed so that the basic material needs of each person on
earth are satisfied and each person has an equal opportunity
to realize his individual human potential.
0. 序:
- ローマクラブ:
10ヶ国から30人のグループがローマのAccademia dei Lincei に集まり、以下の結論に達した。
- 現在の世界の人口、産業、公害、食料生産、資源枯渇の増加率がこのまま続くと、今後100年いないのある時期に、この惑星上の成長の限界に到達するだろう。そうなった場合の最もあり得る結果は、突然のしかも管理不能な状態での人口の減少と産業力の低下である。
- これらの増加傾向を変え、遠い将来に亘って持続可能なような生態学的および経済的な安定の条件を確立することは可能である。世界の平衡状態のデザインは、この地球上のすべての人の基本的な物質的ニーズを満たし、各人が個々の人間的な可能性を実現すべく等しい機会をもつためのものである。
>Top 1. The nature of exponential growth:
- Exponential growth:
A quantity exhibits exponential growth when it increases by a constant
percentage of the whole in a constant time period.
- Old Persian legend:
A clever courtier who presented a beautiful chessboard to his
king and requested that the king give him in return 1 grain
of rice for the first square on the board. 2 grains for the
second square, 4 grains for the third, and so forth.... The
king's entire rice supply was exhausted long before before he
reached the 64th square. Exponential increase is deceptive because
it generated immense numbers very quickly.
- Water lily in a pond:
The lily plants doubles in size each day. If the lily were allowed
to grow unchecked, it would completely cover the pond in 30
days, choking off the other forms of life in the water. For
a long time the lily plant seems small, and so you decide not
to worry about cutting it back until it covers half the pond.
On what day will that be? On 29th day, of course. You have one
day to save your pond.
- Doubling time:
Growth rate (% per year) vs. Doubling time (年)
- 0.1%... 700 years
- 0.5%... 140 years
- 1.0%..... 70 years
- 2.0%..... 35 years
- 4.0%..... 18 years
- 5.0%..... 14 years
- 7.0%..... 10 years
- 10.0%..... 7 years
- Models and exponential growth:
When many different quantities are growing simultaneously in a system
and when all the quantities are interrelated in a complicated way,
analysis of the causes of growth and of the future behavior of the
system becomes very difficult indeed.
-
Economic and Population growth rate:
Most people intuitively and correctly reject extrapolation shown
here, becaue the resuls appear ridiculous.
1. 指数関数的増加の本質:
- 指数関数的増加:
指数関数的な増加を示す量は、一定期間に全体の一定量が増加する。
- 古代ペルシャの伝説:
ある賢い家来が王様に美しいチェス盤を贈った。その褒美として王にその盤の最初の1マスに1粒の米を、第2のマスに2粒を、第3のマスに4粒というように所望した。王のすべての米は64番目のマスの遙か手前でなくなってしまった。指数関数的増加は欺かれやすい。それは巨大な数に非常に早く到達するからである。
- 池の睡蓮:
その池の睡蓮は毎日その数が倍増する。もし睡蓮が自由に増殖できるとしたら30日間で、水中の他の生物を圧倒して池全体を覆うとする。睡蓮は小さいので池の半分を覆うまでは剪定を心配する必要がないとすると、その日は一体いつになるのか。当然29日目である。池を救うには1日しか残されていないのである。
- 倍増時間:
年当たりの増加率と倍増年数
- 0.1%... 700年
- 0.5%... 140年
- 1.0%..... 70年
- 2.0%..... 35年
- 4.0%..... 18年
- 5.0%..... 14年
- 7.0%..... 10年
- 10.0%..... 7年
- モデルと指数関数的増加:
多くの異なる量がシステム内で同時に増加している場合で、かつすべての量が複雑に相互に関連している場合は、成長の原因とシステムの将来像を分析するのは非常に難しくなる。
- 経済成長率および人口増加率:(左表)
多くの人は直感的にここに示された外挿の数字を受け入れないのは正しい。(参照:2000年の実際のGNP)
Country
Population, 1868, M
Annulal growth rate of populatn
1961-68, %
GNP per capita 1968, US$
Annual growth rate of GNP per
capita 1961-68, %
Extraporated
GNP per capita
in
2000
Actual GNP per capita in
2000
China
730
1.5
90
0.3
100
3600
India
524
2.5
100
1.0
140
2200
USSR
238
1.3
1100
5.8
6330
7700
US
201
1.4
3980
3.4
11000
36200
Pakistan
123
2.6
100
3.1
250
2000
Indonesia
113
2.4
100
0.8
130
2900
Japan
101
1.0
1190
9.9
23200
24900
Brazil
88
3.0
250
1.6
440
6500
Nigeria
63
2.4
70
-0.3
60
950
Germany
60
1.0
1970
3.4
5950
23400
>Top 2. The limits to exponential growth:
- Physical & social necessities:
What will be needed to sustain world economic and population growth?
- The first category includes the physical necessities that
support all physiological and industrial activity - food, raw
materials, fossil and nuclear fuels, and the econlogical systems
of the planet which absorb wastes and recycle important basic
chemical substances.
- The second category of necessary ingredients for growth consists
of the social necessitites. The actual growth of the economy
and of the population will depend on such factors as peace and
social stability, education and employment, and steady technological
progress. These factors are much more difficult to assess or
to predict.
- Food:
The primary resource necessary for producing food is land. There
are about 3.2 billion hectares (ha) of land potential suitable for
agriculture on the earth. Approximately half of that land is under
cultivation today.
- The amount of land needed to feed the growing world population,
assuming that the present world average of 0.4 ha per person
is sufficient. (0.9 ha oer person would be required at present
US standards.)
- Symptoms of the crisis will begin to appear long before the
crisis point is reached. Food prices will rise so high that
some people will starve; others will be forced to decrease the
effective amount of land they use and shift to lower quality
diets.
- Each doubling of yield for the land will be more expensive
than the last one. We might call this phenomenon the law of
increasing costs.
- The supply of food to be expected in the future is dependent
on land and fresh water and also on agricultural capital, which
depends in turn on the other dominant positive feedback loop
in the system - the capital investment loop.
- Nonrenewable resources:
Remarks
A
B
C
D
Resource
Static index (yr)
Projected rate of growth
(%)
Exp. index (yr)
Exp. index using 5 times
known reserves (yr)
Gold
11
4.1
9
29
Silver
16
2.7
13
42
Copper
36
4.6
21
48
Natural gas
38
4.7
22
49
Petroleum
31
3.9
20
50
Zinc
23
2.9
18
50
Aluminum
100
6.4
31
55
Lead
26
2.0
21
64
Nickel
150
3.4
53
96
Coal
2300
4.1
111
150
Chromium
420
2.6
95
154
Iron
240
1.8
93
173
- Remarks:
- A: Static index (yr): Calculated by dividing known reserves
by the current annual consumption.
- B: Projected rate of growth of consumption (% per year,
average case)
- C: The number of years known global reserves will last
with consumption growing exponentially at the average annual
rate of growth.
- D: The number of years that 5 times known global reserves
will last with consumption growing exponentially at the
average annual rate of growth.
2. 指数関数的増加の限界:
- 物理的および社会的必要性:
世界の経済成長および人口増加にとって何が必要なのか。
- 第一のカテゴリーは、全ての生理的および工業的な活動のために物理的に必要なもの、食料、原料、化石燃料と核燃料、さらに廃棄物を吸収でき、かつ基本的な化学物質を循環可能な生態学な地球環境である。
- 第二のカテゴリーは社会的必需品を含む成長するに必要な要素である。実際の経済成長および人口増加は平和や社会的安定性といった要素に依存する。これらの要素は評価や予測がはるかに難しい。
- 食料:
食料生産に第一に必要なものは土地である。地球上には農業に適した土地は、およそ32億haある。この土地の約半分が今日耕作されている。
- 増加しつつある世界人口を食べさせるために必要な土地の面積は、世界平均では一人当たり0.4haである。(現在の米国の水準では0.9haが必要)
- 危機の兆候は危機のポイントに至る遙か以前から生じ始める。食料の価格が高騰し、一部の人々が飢え、一方では耕作使用している有効な土地が減少し、低品質の食料生産に移行する。
- 土地の生産量を倍増するために費用はそれ以前に比べて一層高価になる。この現象は費用逓増の法則を呼べよう。
- 将来見込まれる食料の供給は土地、水、および農業への投資額に依存する。この投資額はシステムにおける他のおもな正のフィードバックループ、資本投資ループに依存する。
- 非再生資源:(左表)
各項目の注:
- A: 統計指標 (年数):既知の埋蔵量を現在の年間消費量で割った年数。
- B: 消費の伸び率 (年%、平均予測)
- C: 平均的な消費伸び率による消費を続けた場合の埋蔵量が枯渇するまでの年数
- D: 未知の埋蔵量を加味し、現在の埋蔵量の5倍とし、平均消費伸び率による消費を続けた場合の埋蔵量が枯渇するまでの年数
>Top Consumption of resource:
- For many resources the usage rate is growing even faster than the
population, indicating both that more people are consuming resources
each year and also that the average consumption per person is increasing
each year.
- Chromium ore has one of the longest static reserve indices
of all the resources listed above. The world's known reserves
of chromium are about 775M tons, of which about 1.85M tons are
mined annually. Thus, at the current rate of use, the known
reserves would last about 420 years. The actual world consumption
of chromium is increasing, however, at the rate of 2.6% annually.
If it continues, chromium will deplete in just 95 years. If
we suppose that reserves yet undiscovered could increase present
known reserves by a factor of five, this fivefold increase would
extend the lifetime of the reserves only from 95 to 154 years.
- We have studied this problem with a detailed model that takes
into account the many interrelationships among such factors
as varying grades of ore, production costs, new mining technology,
the elasticity of consumer demand, and substitution of other
resources.
- As demand continues to increase, however, the advance of technology
is not fast enough to counteract the rising costs of discovery,
extraction, processing, and distribution. Price begins to rise,
slowly at first and then very rapidly. The remaining resource,
above 5% of the original supply, is available only at prohibitively
high cost, and mining of new supplies has fallen essentially
to zero.
- Given present resource consumption rates and the projected
increase in these rates, the great majority of the currently
important nonrenewable resources will be extremely costly
100 years from now.
- Trade-offs:
The trade-offs involve choosing between present benefits and future
benefits. In order to guarantee the availability of adequate resources
in the future, policies must be adopted that will decrease resource
use in the present. Most of these policies operate by raising resource
costs. Recycling and better product design are expensive; they are
considered "uneconomic."
- What happens to the metals and fuels extracted from the earth
after they have been used and discarded? In one sense they are
never lost. Their constituent atoms are rearranged and eventually
dispersed in a diluted and unusable form into the air, the soil,
and the waters of our planet. When any effluent is released
on a large enough scale, however, the natural absorptive mechanisms
can become saturated. The wastes of human civilization can build
up in the environment until they become visible, annoying, and
even harmful. Mercury in ocean fish, lead particles in city
air, mountains of urban trash, oil slicks on beaches. It is
little wonder, then, that another exponentially increasing quantity
in the world system is pollution.
- Pollution:
- Carbon Dioxide:
- Per capita energy consumption in the world is increasing
at a rate of 1.3% per year, which means a total increase,
including population growth, of 3.4% per year.
- 97% of industrial energy production comes from fossil
fuels (coal, oil and natural gas)
- Currently about 20 B tons of CO2 are being released from
fossil fuel combustion each year.
- The amount of CO2 in the atmosphere is increasing 0.2%
per year. Only about one half of the CO2 has appeared in
the atmosphere, the other half has apparently been absorbed,
by the surface water of the ocean.
- Radioactive wastes:
- Annual discharge of a 1.6MKW nuclear power plant in US
includes 42,800 Curies of radioactive krypton, and 2,910
Curies of tritium in the waste water.
- Long-lived toxic substances:
- Lead and mercury are released into waterways and in the
atmosphere from automobiles, incinerators, industrial processes,
and agricultural pesticides. Only 18% of mercury is captured
and recycled after use.
- Cadmium, Polychlorobiohenyl (PCB), and DDT:
The level of DDT in fish does not come back down to the
1970 level until the year 1995 - more than two decades after
the decison is made to reduce DDT application.
資源消費:
- 多くの資源の消費率は人口増加よりも早い。このことはより多くの人々が毎年消費し、かつ一人当たりの消費量が毎年増加することを意味する。
- クロムは左表中で、最も長期間消費をまかなえる資源の一つである。クロムの世界の既知埋蔵量は775百万トンあり、年間採掘量は1.85百万トンである。現在の消費量では、既知の埋蔵量は約420年もつ。実際は世界のクロム消費は年2.6%増加している。この傾向が続けばクロムは95年で枯渇する。まだ未発見の埋蔵量があることを想定し、既知の埋蔵量をあわせ5倍と見なしても、埋蔵量の寿命は95年が154年に延びるに過ぎない。
- この問題については、鉱床の品位分布、生産価格、新たな採掘技術、消費需要の弾性性、代替資源など多くの相関関係を考慮したもっと詳しいモデルで検討した。
- 消費は引き続き増加するが、技術は、発見、採掘、加工、運搬のコスト上昇に対応するほど早く進歩しない。価格は始めはゆっくりと、それから急激に上昇する。残りの埋蔵量が当初の5%程度になると価格は購入禁止といえるほど高騰し、新たな採掘による供給は実質的にゼロに落ち込む。
- 資源の現在の消費率が将来も続くとすると、重要な非再生資源のほとんどはこれから100年後は極端に高騰するだろう。
- トレードオフ:
現在と利益と将来の利益の間にトレードオフがある。将来のために資源を入手できるように保証するためには、現在の資源消費量を減らすような政策を採用しなければならない。これらの政策は資源コストを上昇させることで実現される。リサイクルやより良い製品設計には費用がかかる。それらは経済的でないと見なされている。
- 地球から採掘された金属は燃料は、使用され破棄された後どうなるのだろうか。ある意味ではそれらはなくならない。それらを構成する減資は再編され、結果的に我々の惑星上の空気中、地球、水中に希釈され使用不能な状態で拡散される。排出量が大量になると自然による吸収メカニズムが満杯になる。人類の文明の廃棄物が環境に積み上げられ、それらは顕在化し、迷惑し、そして有害となる。海水中の水銀、年の空気中の鉛粒子、山積する都市のゴミ、海岸の油膜などである。世界システムのおけるもう一つの指数関数的な増加量は公害であることは驚くにあたらない。
- 公害
- 二酸化炭素:
- 世界の一人当たりのエネルギー消費は年1.3%増加し、人口増加を考慮して全増加率は年3.4%
- 産業用エネルギーの97%は化石燃料 (石炭、石油、天然ガス)
- 現在約年200億トンのCO2が化石燃料の燃焼によって排出
- 大気中のCO2量は年0.2%増加。CO2の約半分は大気中にあり、残り半分は海水面で吸収される。
- 核廃棄物:
- 160万KWの米国原子力発電所1基は42,800キューリーの放射性クリプトンと2910キューリーのトリチウムを年間に排出
- 長期滞留有害物質:
- 鉛、水銀は、車両、燃焼炉、産業プロセス、農薬から水中および大気中に排出される。使用後の水銀の18%のみが回収されリサイクルされる。
- カドミウム、PCB、DDTなど。
魚中のDDT濃度は1995年にならなければ1970年レベルに戻らない。DDT使用を減らした決定後20年以上も影響する。
>Top 3. The growth in the world system:
 The
purpose of the world model:
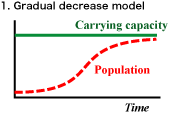
By behavior models we mean the tendencies of the variables in the
system (Eg. population or pollution) to change as time progresses.
A variable may increase, decrease, remain constant, oscillate, or
combine several of these characteristic modes. For example, a population
growing in a limited environment can approach the ultimate carrying
capacity of that environment in several possible ways. It can adjust
smoothly to an equilibrium below the environmental limit by means
of a gradual decrease in growth rate as shown Fig.1.
- Questions
of detail cannot be answered because the model simply
 does not yet
contain much detail. National boundaries are not recognized. Distribution
inequalities of food, resources, and capital are included implicitly
in the data but they are not calculated explicitly nor graphed in
the output. World trade balances, migration patterns, climatic determinants,
and political processes are not specifically treated.
- It
is vitally important to gain some understanding of the causes of
 growth in human society, the limits to growth, and the behavior
of our socio-economic systems when the limits are reached.
- It is currently not known whether the human population will continue
growing, or gradually level off,
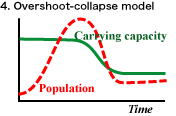 or oscillate around some upper
limit, or collapse.
3. 世界システムにおける増加:
- 世界モデルの目的:
<図1> スムーズな減少モデル
ここではモデルのふるまいによるシステムにおける変数 (人口や公害など) が時間の経過による変化を示す。変数は増加、減少、現状維持、振動、あるいはこれらの特徴の組み合わせとなる。たとえば、環境の制約の中での人口増加が環境の許容上限にどのように近づくかいくつかの方法がある。左図1では、環境上限のすぐ下の平衡状態に、人口増加が徐々に減少することでスムーズに近づくことを示している。
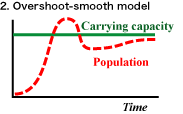
- <図2> 行き過ぎ・均衡モデル
この簡潔モデルでは詳細データを含まないので、およその傾向を示すに過ぎない。たとえば国の違いは無視しているし、食料・資源・資本の流通は、暗黙的に扱われており、明示的には図示されていない。世界貿易収支、移民のパターン、気候条件、および政治的プロセスは個別には扱われていない。
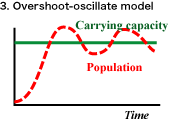
- <図3> 行き過ぎ・振動モデル
人間社会の成長や成長の限界の原因、および限界に達したときの社会経済システムのふるまいを理解することは非常に重要である。
- <図4> 行き過ぎ・崩壊モデル
人口が増加するのか、徐々に一定になるのか、あるいはある上限近辺で振動するのか、それとも崩壊するのかは現在は不明である。
 >Top The
feedback loop structure:
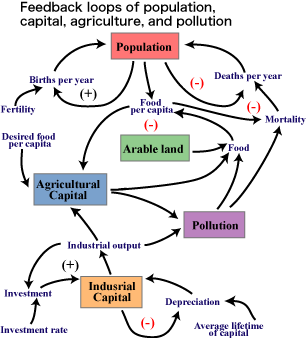
- Each year the population is increased by the total number of
births and decreased by the total number of deaths that have taken
place during that year. The abosolute number of births per year
is a function of the average fertility of the population and of
the size of the population. The number of deaths is related to the
average mortality and the total population size.
- Similarly, a given amount of industrial capital will be able to
produce a certain amount of output each year. Some of that output
will be more factories, machines, etc., which are investments to
increase the stock of capital goods. At the same time some capital
equipment will depreciate or be discarded each year. To keep capital
growing, the investment rate must exceed the depreciation rate.
- The arrows simply indicate that one variable has some influence
on another. For simpl;icity, we ofter omit noting in the flow diagrams
that several of the causal interactions occur only after a delay.
- (+) means possitive feedback loop, while (-) means negative feedback loop.
フィードバックループの構造
- 人口は当該年度の出生数の増加および死亡数の減少によって増加する。 年間出生率の絶対数は平均出生率と人口合計数の関数である。死亡数も平均死亡率と人口合計数の関数である。
- 同様に、産業資本は、毎年一定のアウトプウトを生成することができる。このアウトプットの一部はより多くの工場、機械などであり、これらは資本財のストック増加のための投資である。同時に一部の資本設備は毎年減価償却し、あるいは廃棄される。資本の増加を維持するためには投資率は償却率を上回らなければならない。
- 矢印は、単にある変数が他の変数に影響していることを示す。単純かのために、ここでは図の表現といしては、原因結果が時間を置いて発生することを省いてある。
- (+) は正のフィードバックループを示し、(-) は負のフィードバックループを示す。
>Top 4. The technology and the limits to growth:
- Technology in the world model:
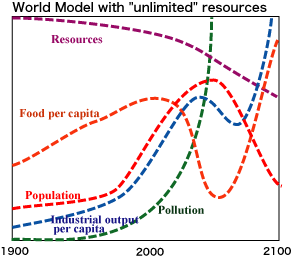
Let us assume that the technological optimists are correct and that
nuclear energy will solve the resource problems of the world. The
result of including that assumption in the world model is shown
here. In this figure resource shortages indeed do not occur. Population
growth is stopped by rising pollution. The absence of any constraint
from resources allows industrial output and services to rise slightly
higher than before they fall. "Unlimited" resources thus
do not appear to be the key to sustaining growth in the world system.
Apparently the economic impetus such resource availability provides
must be accompanied by curbs on pollution if a collapse of the world
system is to be avoided.
- A choice of limits:
There may be much disagreement with the statement that population
and capital growth must stop soon. But virutally on one will argue
that material growth on this planet can go on foreever. Man can
still choose his limits and stop when he pleases by weakening some
of the strong pressures that cause capital and population growth,
or by instituing counterpressures, or both.
- The alternative is to wait until the price of technology becomes
more than society can pay, or until the side-effects of technology
suppress growth themselves, or until problems arise that have
no technical solutions. At any of those points the choice of
limits will be gone.
- We have found that technological optimism is the most common
and the most dangerous reaction to our findings from the world
model. Technology can relieve the symtoms of a proiblem without
affecting the underlying causes. Faith in technology as the
ultimate solution to all problems can thus divert our attention
from the most fundanmental problem - the problem of growth in
a finite system - and prevent us from taking effective action
to solve it.
- The best summary of our position is the followin motto:
"Not blind oppositon to progress, but opposition to
blind progress."
4. 技術および成長の限界:
- 世界モデルにおける技術:
原子力エネルギー世界の資源問題を解決するだろうという技術的楽天主義者が正しいと仮定してみる。その結果は世界モデルにおける推定として左図に示す。ここでは資源の不足は確かに発生していない。人口増加は公害の増加によって抑制される。資源による抑制要因がないことで産業の生産量およびサービスは崩壊の前に若干の増加が見られる。このように資源が無制限であることは世界システムにおいて成長が維持される鍵であるとは言えない。従って世界システムの崩壊を防ぐとしたら、資源が入手可能ということの経済促進効果は公害の抑制を伴わなければならないことは明白である。
- 限界の選択:
人口増加と資本増加はまもなく止まるという主張には多くの異論があろう。しかし実際にはこの地球上で物質の増加は永久に続かないことについては誰も異論ない。人間は、資本増加と人口増加がもたらす強い圧力を一部弱めたり、あるいは逆の圧力をかけたりすることで、まだ人間自身の限界を選択して、満足して留まることができる。
- 選択肢としては、技術の価格が社会が支払い不能なほど高騰するか、または技術の副作用が成長を圧倒してしまるか、あるいはもはや技術的解決がないような問題が生ずるかのいずれかが起こるまで待つことである。このいずれかの段階では限界を選択することはなくなる。
- 我々は技術楽観主義が最も一般的であり、同時にこの世界モデルからの発見に対する最も危険な反応であるという認識である。技術はその根底の原因に影響を与えることなくある問題の兆候を救済できる。技術がすべての問題を解決できるという考えは、有限のシステムにおける成長という最も本質的な問題から我々の注意をそらせるに過ぎず、その解決に向かって有効な行動を取ることを妨げる。
- 我々の立場を簡潔に表現するモットー:
「 進歩に対する盲目的な反対ではなく盲目的な進歩に対する反対である。」
>Top 5. The state of global equilibrium:
- Steady state society:
A few obvious examples of the kinds of practical discoveries that
would enhance the workings of a steady state society include:
- new methods of waste collection, to decrease pollution and
make discarded material available for recycling;
- more efficient techniques for recycling, to reduce rates of
resource depletion;
- better product design to increase product lifetime and promote
easy repair, so that the capital depreciation rate would be
minimized;
- harnessing of incident solar energy, the most pollution-free
power source;
- method of natural pest control, based on more complete understanding
of ecological interrelationships;
- medical advances that would decrease the death rate;
- contraceptive advances that would facilitate the equalization
of the birth rate with the decreasing death rate.
- Equilibrium & Trade-offs:
An equilibrium state would not be free of pressures, since no society
can be free of pressures. Equilibrium would require trading certain
human freedoms, such as producing unlimited numbers of children
or consuming uncontrolled amounts of resources, for other freedoms,
such as relief from pollution and crowding and the threat of collapse
of the world system.
- The final, most elusive, and most important information we
need deals with human values. As soon as a society recognizes
that it cannot maximize everything for everyone, it must begin
to make choices. The equilibrium society will have to weigh
the trade-offs engendered by a finite earth not only with consideration
of present human values but also with consideration of future
generations.
- Action:
Taking no action to solve these problems is equivalent to taking
strong action. Every day of continued exponential growth brings
the world system closer to the ultimate limits to that growth. A
decision to do nothing is a decision to increase the risk of collapse.
5. 世界平衡の状態:
- 定常状態社会:
定常状態の社会 の仕組みを進めるための実践的な発見は以下のようなことである。
- 廃棄物を収集し、公害を減らし、捨てられた物品をリサイクル可能にする新たな方法
- リサイクルを行い、および資源枯渇の割合を減らすのための更なる効率的な技術
- 製品寿命を増やし、修理を容易にするための製品設計。この結果資本の償却率が最小化する。
- 最も公害のすくない動力源としての太陽エネルギーの活用
- 生態学的な相互関係の更なる理解に基づき天然の疫病制御の方法
- 死亡率を減らすような医療の進歩
- 出生率を減少する死亡率と均衡させるような避妊技術の進歩
- 平衡とトレードオフ:
平衡状態とは圧力のない状態ではない。圧力のない社会はあり得ないからである。平衡状態はある意味での人間の自由、例えば子供を制限なく生むことや資源を無制限に消費することなどの自由と、他の自由、例えば公害や混雑、あるいは世界システムの崩壊からの解放とのトレードオフ関係にある。
- 我々にとって最もわかりにくい最終的で最も重要な情報は人間の価値に関わることである。社会が誰に対してもすべてのものを最大化できないという認識をすると、それは選択を迫られることになる。平衡社会では、有限の地球を現在の人間にとっての価値への配慮だけでなく、未来の世代への配慮によって生じるトレードオフを推し量らなければならない。
- 行動:
これらの課題を解くための行動を起こさないことは、強い行動をとることに等しい。毎日毎日、指数関数的増加によって世界システムが究極の成長の限界に近づきつつある。何も行動しないという決定は崩壊のリスクを増やす決定と同じである。
Comment
- The report of The Club of Rome
written in 1972 is still varid and persuasive now in 2003. Pursue of
freedom should not include the freedom to cosume unlimited petroreum,
rather should include freedom from global warming mentioned in the Kyoto
Protocol.
- 1972年にかかれたローマクラブの報告書は2003年の今でも有効で説得力がある。自由の追求には無制限の石油を消費する自由は含まれず、むしろ京都議定書で示されたような地球温暖化からの自由を含むべきである。
 |
The Limits to Growth
|
|
Cat: SCI
|
Donella H. Meadows, Denis L. Meadows, etc. |
02531u/18130r |
Title |
The Limits to Growth |
成長の限界 |
|---|---|---|
Author |
Donella H. Meadows, Dennis L. Meadows, etc. | D. H. メドウズ他 |
Published |
1972 |
1972年 |
Index |
||
Why? |
|
|
Summary |
要約 |
|||||||||||||||||||||||||||||||||||||||||||||||||||||||||||||||||||||||||||||
>Top 0. Introduction:
|
0. 序:
|
|||||||||||||||||||||||||||||||||||||||||||||||||||||||||||||||||||||||||||||
>Top 1. The nature of exponential growth:
|
1. 指数関数的増加の本質:
|
|||||||||||||||||||||||||||||||||||||||||||||||||||||||||||||||||||||||||||||
|
||||||||||||||||||||||||||||||||||||||||||||||||||||||||||||||||||||||||||||||
>Top 2. The limits to exponential growth:
|
2. 指数関数的増加の限界:
|
|||||||||||||||||||||||||||||||||||||||||||||||||||||||||||||||||||||||||||||
>Top Consumption of resource:
|
資源消費:
|
|||||||||||||||||||||||||||||||||||||||||||||||||||||||||||||||||||||||||||||
>Top 3. The growth in the world system:
|
3. 世界システムにおける増加:
|
|||||||||||||||||||||||||||||||||||||||||||||||||||||||||||||||||||||||||||||
|
フィードバックループの構造
|
|||||||||||||||||||||||||||||||||||||||||||||||||||||||||||||||||||||||||||||
>Top 4. The technology and the limits to growth:
|
4. 技術および成長の限界:
|
|||||||||||||||||||||||||||||||||||||||||||||||||||||||||||||||||||||||||||||
>Top 5. The state of global equilibrium:
|
5. 世界平衡の状態:
|
|||||||||||||||||||||||||||||||||||||||||||||||||||||||||||||||||||||||||||||
Comment |
|
|