Résumé |
Remarks |
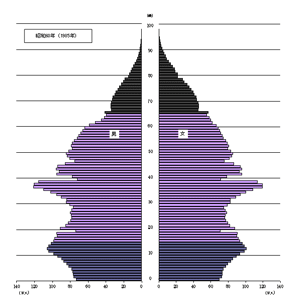
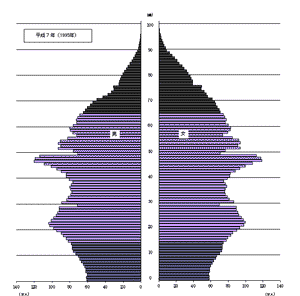
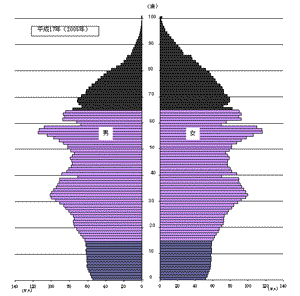
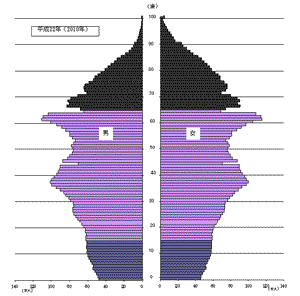
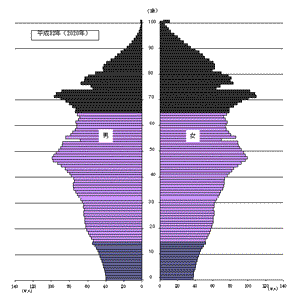
>Top 0. Population Pyramid of Japan:
- Number of new born baby girls is decreasing:
1130K/1950 →760K/60 →920K/70 →700K/85 →590K/95 →520K/2005 →450K/10 →380K/20 →340K/30 →290K/40 →240K/50
- Population pyramid looks like population tsunami, which attacks Japanese economy seriously.
- It is usually mentioned as 'aging population and less children society of Japan'; but the most seriousness is 'less new born baby girls in Japan!'
|
>Top 1. Shell of prejudice,:
- The debate of business situation in Japan tends to focus on the final index of GDP or GDP growth rate, but it is more important to notice basic factors causing GDP such as business achievement, private consumption, export & import results, etc.
- Repetition of macro-economic slogans such as to promote 'growth strategy', 'more anti-deflation measures', or 'more monetary relaxation' could not be persuasive.
- It is also a hen & egg discussion: cause - consequence relation could be ambiguous; which should be the first, domestic demand expansion or economic recovery!
- It is an xxaggeration or overstatement when expressed as once a hundred years recession. We need to know the fact what happedn during the period of economic burst around 1990 in Japan.
- Feedback from reality is very important; not only deductive thought but also inductive way of analysis.
|
1. 思い込みの殻:
- GDPの基本要素に着目
- 原因か結果か
- バブル期に何が起きたのか
|
>Top 2. Winner in global competition:
- Japanese financial assets has not yet deteriorated (Negative wealth effect)
- Japanese private financial assets decrease ¥110T in 2008; as ¥1544T in 2007 became ¥1434T in 2008.
- But what about this figure in US$ or Euro basis? Japanese yen had been upvaluated about 10-20% during this period, which is advantageous in importing foods and resources.
- Trade surplus:
- ¥8T plus in 2001; which increasd ¥12T plus in 2007 when the prices of natural resources surged ($147/bbl in July 2008).
- Export amount attained ¥80T in 2007 at record high; which attained ¥41T plus when the bubble economy collaped in 1990.
- Export amount had dropped from ¥77T in 2008 to ¥51T in 2009 due to the world simultaneous economic slowdown, but still kept high level of export amount.
- Continues trade surplus in economic slowdown:
- Food self-sufficiency is about 41% (calorie base inn 2008), which is the worst in advanced countries; but which amountes only ¥9T, occupying a small portion of import amount.
- Most of the import belong to variable cost, not fixed cost; which mostly correspond to the export amount.
- Import amount precedes the export in statistics, because advanced arrangements are needed to secure natural resources. (usually several months)
- >Top Japanese productivity:
- Productivity is to the numerator what export is to the number of sales.
- The main reason of lower productivity of Japan is due to over production capacity which enforced discounting competition in the market. (Lower cost mass production)
- The numerator of productivity is added value; internal reserve and labor cost are the main portion of the numerator. These figures has shown structurally lower level in Japan; not due to bigger number of labors as the denominator.
- Japanese income balance:
- about ¥3T in 1990, but increased ¥16.3T in 2007 (five times more), and ¥15.8T even in 2008.
- Now Japan is an alert moneylender, though its government is the biggest debtor (¥1000T), borrowing mostly from Japanese individuals and corporations.
- Thus, the current balance was; ¥6T in 1900, and ¥25T in 2007.
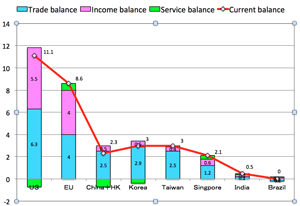
- >Top Trade balance with partners: (→figure: unit ¥T)
- Trade balance; Income balance; Service balance; and Current balance in 2008.
- China+Hong Kong (Triangle trade): Current balance with China+HK is ¥2.3T.
- Singapore; 80% population is Chinese-Singaporean; current balance is ¥2.1T. Singapore is a future scenario of China.
- Japanese 'brand' is the source of trade strength; playing like a jewelry store in neighboring Asia.
- Stronger branded jeweller stores in the world:
- France, Italy, and Switzerland
- They are proud of light industries; foods, textile, leather goods, furniture, jewelry, etc.
|
2. グローバル競争の勝ち組:
- 日本の金融資産はまだ堅調?
- 個人金融資産は2008年に110超円も毀損
- しかしドルやユーロベースでは。
- ほとんどの輸入品は変動費。輸出に連動
- 輸入額は統計上先行
- 日本の労働生産性
- 貿易相手国バランス
- 日中、香港間の三角貿易
対中輸出は香港経由、輸入は直接
|
>Top 3. Shrinking domestic demand:
- Shrinking domestic demand continues which is irrelevant to current global competition.
- Sales of new cars decreased as much as 6M in 2000; continued gradually decreasing in sales since 2000.
- For most of the Japanese (except residents in the metropolitan area), cars are necessary articles, not favorite ones.
- Other items are also constantly decreasing of sales, such as:
- Sales of department stores; supermarkets; mail-order shopping; bookstores; travels; liquors; mineral water; use of water; intake of protein & fat.
- The peak of sales were around 1997, and then decreasing gradually.
- Long-term trend of analysis are needed based on the absolute number, not by ratio; year-to-year growth rate, let alone quarterly results or month-to-month growth。
|
3. 縮小する国内需要:
|
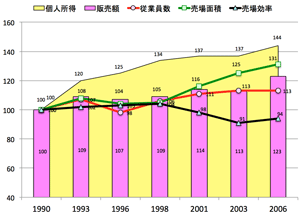
>Top 4. Regional divide:
- Regional divide is a false charge?
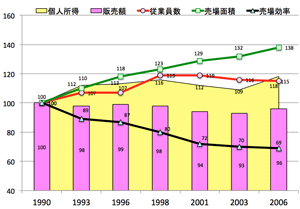
- Case of Aomori prefecture:
- Peak of personal income was 1998:
- Sales amount corresponds to personal income; 1998 peak.
- still active in 1990 when the bubble economy bursted.
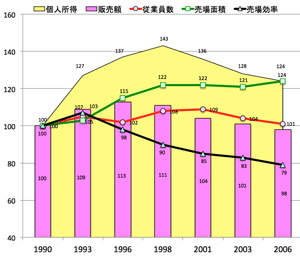
- Regional decline does not reflect the growth in metropolitan area.
- Personal income was peak in 1998.
- Sales amount in metropolitan area includes headquarters sales where mostly located.
- Both metropolitan area and regional area simultaneously show declining since 2000.
- Reverse divide occurs:
- Sales efficiency=Sales amount/Sales area: Metropolitan area ¥1.69M/sq.m vs. Akita area ¥0.75M/sq.m
- Okinawa prefecture is unique:
- Okinawa is the only prefecture in Japan where both number of employee and individual income increase steadily.
- Analysis of based on the available jobs ratio and unemployment ratio could be misleading; absolute figures matter.
- General sales trend in Japan:
- 1990-1996: personal income and sales increase, though the bubble economy bursted.
- 1998-2003: Economic recession
- 2003-2006: Economic recovery by export increase.
- Difference among these periods are bigger than the regional difference.
|
4. 地域間格差:
- 地域間格差の現状:
例:首都圏、青森、沖縄
- 首都圏の成長は地方衰退の裏返しか
- 内需動向は地域間格差より時期に依る。
- 1990-96: 個人所得も内需も増加
- 1998-03: 不況
- 2003-06: 輸出増による景気回復
- 内需動向はこの間の時期次第
|
- Regional disparity (Retails in Metropolitan area)
|
- Regional disparity (Retails in Aomori)
|
- Regional disparity (Retails in Okinawa)
|
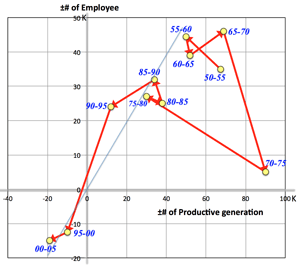
>Top 5. Decrease of productive generation :
- Productive generation: 15 - 64 year-old people by Japanese statistics, which should be called as 'consumable generation'
- 2000-2005 in Aomori prefecture: the population decreased to 39K. During this time, productive generation decreased to 54K, which is 1.4 times more than decreasing ratio of total prefectural population.
- It is more serious that productive generation is rapidly decreasing than total population.
- Increase of elderly people results decrease of tax-payers and increase of medial & health care fee. Also it results decrease of sales amount, either.
- It is usual expressed as 'less children and aging society', but which is ambiguous; aging society could not be prevented by having more babies. The decrease of productive (and consumable) generation causes.
- Economics has not assumed the society whose productive generation decreases though all population increases. (Such strangeness really happens now in metropolitan areas.)
- >Top Triple down effects: 1) rapid increase of elderly people, 2) constant decrease of children, and resulting 3) constant decrease of productive generation (furthermore incudes not a few number of relatively poor irregular employment.)
- 'Call option' tendency of elderly people: elderly people consume much less; they worry for their future, reserving their money to buy a kind of call option for the future medical & health care services.
- Ranking of the decrease of productive generation: (2000-2005)
- 1) Osaka, 2) Hokkaido, 3) Saitama, 4) Hyogo, 5) Chiba
- In Tokyo; productive generation increaed10K, while elderly people also increased 390K.
- Okinawa is an exception: productive generation increased 40K, and elderly people also increased 40K; mainly due to elderly people born in the latter 1930s were died during Okinawa ground battle in 1945, about 1/3 was sacrificed. Thus the number of elderly people is relatively small.
- The baby boomer generation:
- the generation born in latter 1940s after WWII.
- In Aomori prefecture, elderly people more than 75-year old are estimated to increase 55K in the next decade. What will happen then?
- Care service facilities will be needed as much as 5.5K (=10% of 55K); several thousand care workers will be needed to support this. This trend will be more accelerated as the baby boomer generation enters as being cared generation.
- >Top Once a two millennium phenomenon: Japan has not experienced such situation.
- Metropolitan area is estimated becoming an 'explosion of health care needs'
- increase of elderly people; 1.54M (63% increase)
- additional health care facilities will be needed for 150K (10% of 1.54M), where several ten thousand care workers will be needed.
- during this period, productive generation will decrease 6% in a decade. (In Aomori 13% decrease of productive generation.)
|
5. 生産性世代の減少:
- 未曾有の生産性世代の減少:
生産性世代 15-64歳。実際には消費世代というべき。
|
>Top 6. Population wave:
- In Japan, fluctuation of number of productive generation has mostly corresponded to the total number of employees; because unemployment ratio is much lower than other countries.
- Thus, the number of employee has no direct relationship with economic conditions.
- It has been traditional behavior since WWII, Japanese major corporations adopted as many new graduate according to the number of graduates, considering corporate stainability and future possibility of the next generation.
- >Top It should be called as 'Population onus': But the trend of 1995-2000 and 2000-2005 turned the tide, showing very different phase from other periods; the retired people at their limit age outnumbers new employees.
- 2010-2015: The baby boomer generation will exceed the age of 65; then productive generation decreases 4.48M in five years.
- However, export industry could survive by investing in plant and equipment to keep their productivity and profit trying further reduction of labor cost.
- Such population onus would behave like rise of ocean level by global warming.
|
6. 人口の波:
|
>Top 7. Labor productivity:
- Definition of productivity (correctly labor productivity) is: output or value-added amount per one labor.
- Here, the value-added amount = profit + a part of cost (like labor cost and rental fee which are paid locally); in the case of GDP; the locality means Japan.
- If a company whose profit margin is lower by focusing their quick-return policy, procuring raw materials and facility form other places, the local value-added amount never increases.
- Because locally paid cost will become sales of other local companies; thus local economy will benefit by such value-added amount.
- Traders in Ohmi region in Edo period emphasized the optimization of their profit among the seller, buyer, and local community. They recognized the importance of local community.
- >Top Which are mostly valued-added industry?: actually industry hiring many labors, and providing services which is difficult to attain efficiency. (high-mix & small lot production)
- Service industry
- Textile, chemistry, steel
- Retail
- Food production
- Construction
- Electronics
- Automobile
- Outdated stakeholder capitalism emphasizing ROE or ROI:
- Demand-side centric operation is needed: corporations which provide added-value to the customers, and getting profit in return for their services.
- corporations who attach great importance of short-sighted shareholders not only could not survive in the market, but also deteriorate local community.
- increase of productivity could not be attained by cutting personnel and labor cost.
- products which do not depend on the number of consumers could be the target; customers will buy more and more brand or artistic-oriented products such as jewelry, antique, financial products, Ferrari, or Harley-Davidson.
- Japanese overcapacity of production of commodity product needs to be adjusted to the level of real figure required by the productive generation.
- Raise of productivity may decrease GDP: here is a simulation:
- Assume that the employee is decreased from 100 to 90 (10% down).
- Such cost reduction is spent for reduction of sale cost.
- Then, the value-added amount may decrease from 100 to 99; where, the productivity increases 0.99/0.9=1.1 (10% up). But the value-added amount decreases 1%.
- If this company mostly depends on domestic market, then excessive competition could be unavoidable.
|
7. 労働生産性:
- 労働生産性の定義:
- 労働者一人当たりの付加価値額
- 付加価値額=企業利益+地元支払いのコスト
- GDPの場合、地元とは日本
- 金は天下の回りもの
三方良しの世間とは
- 団塊世代+団塊ジュニアが生産力を増強してきた。
- 今後は生産年齢人口に連動したレベルまでの調整が必須。
|
>Top 8. What Japan should do now?:
- Better policy should be:
- To defer the pace of decreasing number of productive generation.
- To increase or maintain the total amount of private income of productive generation.
- To increase or maintain the total amount of personal consumption, by productive generation as well as elderly people.
- Bad policy is:
- To do nothing about decreasing number of productive generation.
- Not to increase of private income of productive generation.
- To consider too much for rich people who tend to financial investment, and to make light of increasing the personal consumption by productive generation and elderly people.
- To promote too much on public investment increasing tax and/or national debt.
- Behavior of big companies:
- they willingly follows to liquidate employment (temporary workers) and lower labor cost (working poor), but are reluctant to change total environment of employment, keeping vested interests of core personnel or retired OB.
- Behavior of rich elderly people: (2004-07)
- their total financial asset decreased ¥110T in 2008, but they didn't increase purchase.
- We don't want to rely on 'Hey it's me scam'.
|
8. 日本の今すべきこと:
- 良い政策3つ:
- 生産性世代の減少を少なくする。
- 生産性世代の個人所得の増加
- 生産性世代とシニア世代の個人消費の増加
- 高齢富裕層
2008に金融資産110兆円毀損したが、モノの購入をしなかった。
|
>Top 9. Redistribution of income to youth:
- In 2040: Productive generation will decrease 30% compared to 2005. In order to maintain the total private income of the youth, it is needed to increase their income 1.4 times more; 0.7 × 1.4 = 0.98 almost becomes 1.0
- A policy that the youth income should be increased 40% more in 35 years.
- where, the youth is assured 20-45 years old, including men and women; mostly transferred from rich elderly people who could not spend their assets during life time.
- In Japan, there are 1.5M rich people who owns more than ¥100M financial assets per head (excluding real estate). The total amount is about ¥400T.
- Tips of success:
- To produce attractive products & services for rich elderly people who want to buy.
- To prepare good reasons to purchase more by them. (more ecologically-oriented products & services, etc.)
- To supply with reasonable prices to curb the flexible production cost. (cost down efforts to raise the selling price); elderly people are sensitive to the prices.
- >Top To prepare tax incentive for a gift inter vivos.
|
9.
若者への所得移転:
- 富裕高齢者から若者への資産移転;
富裕高齢者は150万人、一人1億円以上所有(除く不動産)
- 生前贈与
|
>Top 10. Gender equality:
- It is effective to increase more employment for women (gender equality)
- In Japan, only 45% of women are employed or paid. (about 70% in Holland)
- 12M women are full-time house-wife, who are not paid.
- Any aged women tend to spend more than elderly men.
- Barriers to prevent gender equality:
- Men's mindset; men should work outside.
- Other women's frustration to working women/
- Who do the housework.
|
10.
女性機会均等:
- 日本の45%は有償労働者ではない。
- 専業主婦は1200万人
- 女性の機会均等を阻むもの
|