Résumé |
Remarks |
>Top 0. Introduction: |
|
0. : |
>Top 1. Mobile phone and Internet penetration:
- Mobile phone penetration in 2012: 89.5%
- Internet penetration in 2012: 35.4%
|
Mobile penetration 2012:
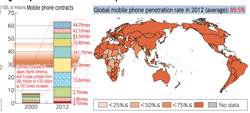
|
Internet penetration 2012:
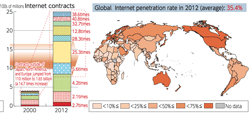
|
>Top 2. Mobile Money Services:
|
Trend of Mobile money services:
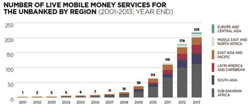
|
>Top 3. Comparision of ICT Investment:
- Robert Solow's Paradox: in 1980s, productivity gains were negligible despite ICT investment.
- Today, many reports have confirmed that ICT does in fact increase productivity and contribute economic growth.
- Japanese ICT investment levels are lower than those of EU and US.
- Japan was exceeded by US and UK from 1990, and by Germany from 2000.
|
Trend of ICT Investment:
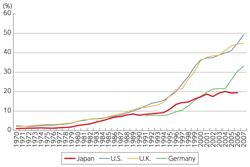
|
>Top 4. Relationship of investment on ICT or Organizational change - HRD:
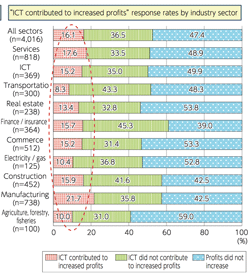
- ICT is a growth engine for Japan and further ICT usage is imperative.
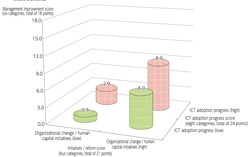
- ICT (low)+Organizational change & HRD (high) is more effective than ICT (high)+Orgainzaional change & HRD (low)
|
 |
|
>Top 5. ICT Growth Straegy II:
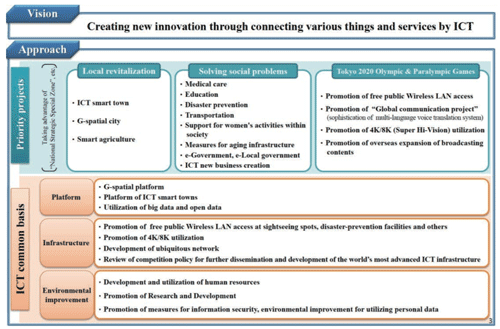
- Japan should seek to:
- Creation of new and innovative industries.
- The world's afest and most disaster-resilient society.
- One-stop public services for anyone and from anywhere at any time.
|
|
>Top 6. Roadmap for broadcasting:
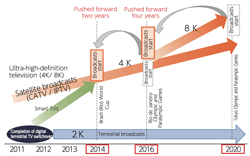
- 4K broadcasts started in Jun. 2014 as the first step toward 4K and 8K of ultra HDTV.
- 8K braodcasts will start from 2016.
|
|
>Top 7. Major players in ICT industries:
- Japanese major ICT related companies: Sales as of Mar. 2014 ($B):
Hitachi 96; Sony 78; Panasonic 77; Softbank 67; Toshiba 65; DoCoMo 45; KDDI 43; Fujitsu 48; KDDI 43; Mitsubishi-Elec 41; NEC 30; Sharp 29; NTTData 13
- World major ICT related companies; Sales in ($B):
Samsung 224; Apple 176; AT&T 133; Verizon 124; IBM 103; Amazon 77; MS 65; Google 62; Cisco 50; Ericsson 36; Oracle 28; SAP24; Kokia 18
- Overseas expansion by Japanese ICT industry:
- Electrical devices 61.2%
- ICT devices 59.5%
- Precision devices 56.4%
- Information services; 39.5%
- Communications: 39.3%
|
- Major player of ICT industries
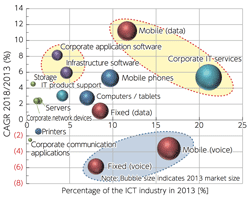
|
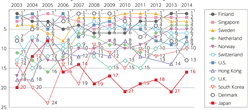
- Strength and weaknesses of Japanese companies:
- Strength:
1) Functionality and quality of products & services.
- Weakness:
1) Price competitiveness
2) Speed of decision making
|
>Top 8. ICT International Competitiveness Enhancement: (Jun. 2014)
- Japan stands at a a historical crossroads as fara sa sustainable growth. The report visions by 2020:
- To aim knowledge-driven & information-driven nation (Smart Japan)
- To stimulate ICT international expansion by public-rivate coopeartion.
- To encompass infrastructure, disaster management, content, medical care, education, resources, e-Government, and financing. (Keywords: safety, security, & hosipitality)
- To promote industry, government, and academia collaboration. (all-Japan)
- To encourage VC; to establish ICT showcases (Japan brand); to develop ICT personnel.
- Numerical target of overseas sales in ICT field; ¥17.5T ($175B) by 2020 (5 times more than 2012)
|
8.
| Outlook of globalization by ICT Industry |
% |
| Exports |
31.3 |
| Investment: 100% |
21.6 |
| Investment:50%-99% |
18.4 |
| Investment: <50% |
12.8 |
|
>Top 9. Value generated by big data:
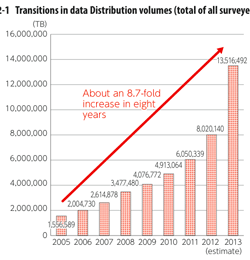
- Soaring volume of digital big data: 1.8 zettabytes in 2011 to 40 zettabytes in 2020.
- Due to proliferation of social media and cloud services. And wearable devices and M2M and IoT technology.
- Deviecs long considered unrelated to communicaions are expectd to becom entwinde with communcations generating massiv data.
- Most common responses of big data:
- don't know howo to use data.
- no internal system to analyze and use data
- difficult to assess the cost benefit ration of data use
- costs to analyze and use data
- data sets are scattered and difficult to analyze.
|
Increase of big data:
|
9.
Type of Big Data: (%)
| Info. on customer |
50.2 |
| Accounting info. |
42.8 |
| Documentation, logs |
41.7 |
| Transaction records (POS...) |
33.8 |
| Statistical info. |
19.0 |
| Image info. |
14.7 |
| Credit info. |
14.3 |
| Various system logs |
13.5 |
| Website content (own) |
13.2 |
| Questionnaire data |
12.3 |
| Website visit logs |
12.3 |
| Experiment record |
11.4 |
| Website content (company) |
7.4 |
| Data from sensor |
5.3 |
| GPS info. |
3.2 |
| Twitter on Facebook |
2.9 |
|
>Top
10. Geospatial Information System (GIS):
- As of 2013, 40.4% of prefectural governments, along with 44.8% of municipal governments had introduced integrated GIS.
|
Promising fields for GIS: 2014
| Disaster management |
82.5% |
| City infra. |
57.6 |
| Tourism |
55.5 |
| Healthcare, welfare |
53.9 |
| Security |
49.4 |
| Trafic |
40.9 |
| Education |
37.8 |
| Energy & Environment |
33.8 |
|
Problems for expanding GIS: 2014
| Tough financial conditions |
59.9% |
| Cannot be used across divisions |
47.6 |
| Lacking promotion systems |
43.5 |
| Lacking employee skills |
41.1 |
| Lacking personnel |
40.4 |
| Cannot provid GIS to public |
36.8 |
| Have no specific usage |
34.4 |
| Concern about data update |
32.7 |
|
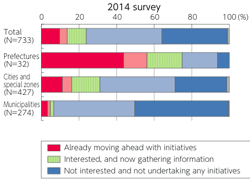
>Top 11. Promotion of Open Data:
- Open Gov Data Strategy in Jul. 2012:
- Declaration of Most Advanced IT Nation:
- G8 Summit in 2013; G8 Open Data Charter.
- Roadmap of Open Gov. Data Strategy
- Unrestricted secondary use of public data.
- Int'l standard machine-readable data format
- Trial version during FY2013 (Data catalog site; DATA.GO.JP
- Full scale operation from FY2014
|
Sensitive personal data:
| Type of info. |
very impo |
relativ. impo |
| Address |
58.5% |
21.6% |
| TEL number |
57.7 |
22.8 |
| Personal ID # |
55.2 |
18.7 |
| eMail address |
49.2 |
28.1 |
| Biological info. |
49.0 |
21.8 |
| Name |
45.3 |
24.0 |
| Date of birth |
33.4 |
31.5 |
| School name |
32.3 |
32.1 |
|
Public Data considered for publication:
| Statistical data |
23.0% |
| Disaster management |
22.0 |
| Sightseeing information |
18.0 |
| Geographical map |
17.0 |
| Public facility |
17.0 |
| Crime prevention |
16.0 |
| Healthcare & welfare |
15.0 |
|
>Top 12. Current state of ICT industry:
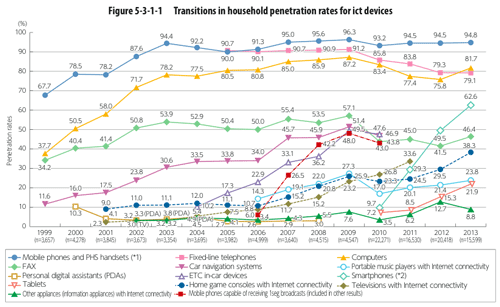
- Fixed telephone has falen consistently since 2008.
|
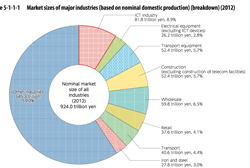
| Market size of all industries 2012 |
¥924.0T |
100% |
| ICT industry |
81.8 |
8.9 |
| Whole sales |
59.8 |
6.5 |
| Transport equip |
52.4 |
5.7 |
| Construction |
52.4 |
5.7 |
| Transport |
40.6 |
4.4 |
| Retail |
37.6 |
4.1 |
| Iron & Steel |
27.8 |
3.0 |
| Electrical equip |
26.2 |
2.8 |
|
| ICT Industry Sales 2012 |
¥42.5T |
100% |
| Telecom service |
15.7 |
37.0 |
| SW service |
11.6 |
27.3 |
| Info. process service |
6.0 |
14.2 |
| Private broadcast |
2.2 |
5.2 |
| Internet service |
1.9 |
4.4 |
| Newspaper |
1.6 |
3.7 |
| Publication |
1.2 |
2.8 |
| Cable broadcast |
0.5 |
1.2 |
|
>Top 13. Penetration rate for ICT devices: (2013
| Mobile phone |
94.8% |
| Computer |
81.7 |
| Fixed line telephone |
79.1 |
| Smart phone |
62.6 |
| FAX |
46.4 |
| Home game (internet) |
38.3 |
| Portable music player (internet) |
23.8 |
| Tablet |
21.9 |
|
 |
>Top 14. Personal concerns of internet usage:
| disclosure of personal information |
81.4% |
| computer virus infection |
76.7 |
| trustworthiness of e-payment |
47.4 |
| unsolicited email |
46.5 |
| unsure how far security measures be taken |
45.0 |
| false billing & other internet fraud |
42.9 |
| one's own understand of internet usage |
34.5 |
| authentication technology |
16.1 |
| illegal & harmful information |
15.5 |
| vilolation of IP rights |
13.0 |
| internet addiction |
10.2 |
| unsure of email is sent or received |
8.2 |
| confilict with comm. partners |
7.7 |
|
- Info. security measures at houiseholds: 2013 (n=11603)
| Taken measures |
77.6% |
| |
anivirus SW |
58.4 |
| |
security service |
27.7 |
| |
not connect to untrusted connection |
22.4 |
| |
passwords on devices |
14.6 |
| |
set adminstrator |
3.1 |
| have not taken measures |
22.4 |
|
- Info. security measures at enterprises:
2013 (n=2123)
| Implemented measures |
98.5% |
| |
antivirus SW on CP |
87.2 |
| |
antivirus SW on server |
66.0 |
| |
ID & password |
55.3 |
| |
firewall |
44.0 |
| |
security patches on OS |
35.7 |
| |
access log |
29.3 |
| |
proxy server |
22.3 |
| |
moniter access line |
11.0 |
| |
authentication technology |
10.7 |
| |
antivirus response |
10.3 |
| |
intrusion detection system (IDS) |
9.1 |
| |
outsource security mgmt |
8.3 |
| |
Web app. firewall |
7.5 |
| No implemented measures |
1.5 |
|
>Top 15. Use of cloud services:
- Online usage by local governments:
| FY |
OL usage ratio |
| FY2008 |
27.6% |
| FY2009 |
36.1 |
| FY2009 |
41.0 |
| FY2010 |
40.0 |
| FY2011 |
42.6 |
|

|
|


