Renewables
2014
Cat: ENE
Pub: 2014
#: 1420b
Renewable Energy Policy Network for 21st Century
UP 14911
Titile
Summary of REN21 Report 2014
REN21再生可能エネルギー報告2014
Why
- REN21 is a globally networked organization who provides neutral and fact-based information of renewable energy.
- REN21's activity is first recognized at the WFES conference at Abu Dhabi, where UN and other major countries participated.
- I also attended the WFES 2012, and became a watcher of the activity.
- From 2014 edition, REN21 report mentions, "The most notable was Japan, where investment in renewable energy (excluding research and development) increased by 80% relative to 2012 levels."
- REN21は、国際的に再生可能エネルギーに関する客観的なデータを提供している機関である。
- このREN21の活動は、2012年Abu DhabiでのWFES国際会議で始めて知り、その後、報告書を注目するようになった。
- REN21の2014版では、日本が再生可能エネルギー分野2012年比べて80%増加した旨の記述がある。
Résumé
Remarks
>Top 0. Executive Summary:
- TOP Five Countries:
- Annual Investment:
-
Investment in renewable
China
US
Japan
UK
Germany
Geothermal
NZ
Turkey
US
Kenya
Phillip.
Hydropower
China
Turkey
Brazil
Vietnam
India
Solar PV
China
Japan
US
Germany
UK
Concentrated Solar Power (CSP)
US
Spain
UAE
India
China
Wind
China
Germany
UK
India
Canada
Solar water heating
China
Turkey
India
Brazil
Germany
Biodiesel
US
Germany
Brazil
Argen.
France
Fuel ethanol
US
Brazil
China
Canada
France
- Features:
- Solar power was again the leading sector during 2013, receiving 53% ($113.7B) of total new investment in renewable power.
- Wind power followed with $80.1B.
- Total investment in renewable energy, totalling $133.4B.
- 1.3B people still do not have access to electricity.; 2.6B people rely on traditional biomass.
- increase use of mini-grids for renewable energy-powered electrification.
- Renewable Energy Power Generation Capacity 2012 - 2013: GW
-
Sustainable energy
2012
2013
Remarks
Renewable power capacity (excl. Hydro)
480
560
Renewable power capacity (incl. Hydro)
1440
1560
Hydropower
960
1000
Modernization of facilities needed.
Wing power capacity
283
318
Offshore wind have a record year, almost in EU.
Solar PV capacity
100
139
China spectacular growth.
Module prices stabilized, while production costs continue to fall.
Bio-power capacity
83
88
60% is traditional biomass.
Geothermal capacity
11.5
12
CST capacity
2.5
3.4
Concentrating Solar Thermal Power.
Larger plants are advantageous.
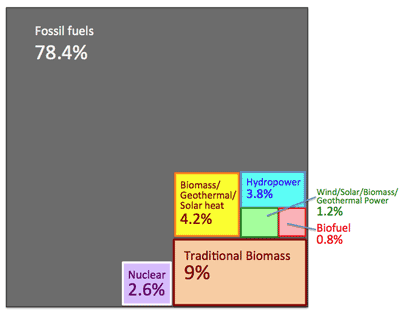
- Estimated Renewable Energy Share of Global Final Energy Consumption, 2012:
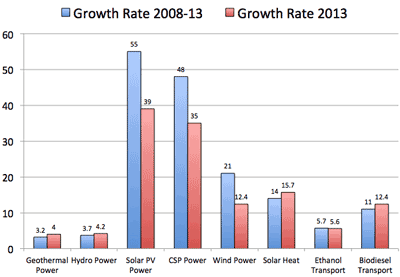
- Average Annual Growth Rates of Renewable Energy Capacity: 2008 - 2013
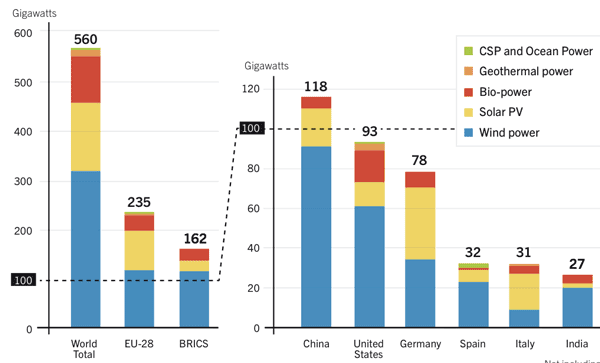
- Renewable Power Capacities in World, EU28, BRICS, and Top Six Countries, 2013:a
- Bio, Geothermal and hydropower have long been cost effective in areas where good resources are available.
- Onshore wind and particularly solar PV have fallen sharply, while costs from coal and natural gas generation have increased due to higher capital costs and feedstock prices.
- By the end of 2013, China, US, Brazil, Canada and Germany remained the top countries for total installed renewable electric capacity.
- BRICS led 38%, EU had the most non-hydro installed capacity 42%.
- Biomass Resources:

- The output of biomass resources are; 1) food, 2) animal feeds, 3) chemical feedstock, 4) materials, and 5) energy.
- Global annual primary biomass demand; 55.6 EJ, which are supplied by modern bio-energy and traditional biomass.
- 5 GW of bio-power capacity was added for a total of 88 GW in operation in 2013.
- Average capacity factor of over 50%.
- US (15.8 GW) is the top producer of electricity from biomass, followed by Germany, China, and Brazil.
- Ethanol, Biodiesel, and HVO Global Production; totalling 116.5 B liters.
- Wood pellet global production in 2013, totalling 23.6 M tones.
0. 概要:
- 再生可能エネルギー先進5ヶ国
- 9項目中、中国5、米国3項目でトップ
- 日本は2ヶ所に登場
- 投資額3位
- 太陽光2位
- 各再生可能エネルギーの発電容量 2012/2013比較
- 最終エネルギー消費の中の再生可能エネルギーシェア, 2012
- 再生可能エネルギーの伸び:(2008-2013)
- 再生可能エネルギー先進6ヶ国:
- 中国
- 米国
- ドイツ
- スペイン
- イタリー
- インド
- バイオマス
>Top 1. Economics of Renewable Energy: (再生可能エネルギーの経済)
Type
Characteristics
Capital
(US$/kW)
Energy cost:
US¢/kWh
Hydropower
Grid-based
1 -18000+ MW
Reservoir, run-of-river
capacity factor 30-60%
>300MW; 1000-2250
20-300MW: 750-2500
<20MW: 750-4000
>20MW: 2-12
<20MW: 3-23
Hydropower
off-grid/rural
0.1 - 1000 kW
Run-of-river, hydrokinetic, diurnal storage
1175-6000
5-40
Solar PV
Rooftop
Peak capacity
3-5 kW (residential)
100 kW (commercial)
500 kW (industrial)
Capacity factor: 10-25% (fixed tilt)
Residential costs:
2200 (De): 3500-7000 (US): 4260 (Jp); 2150 (Cn); 3380 (Au); 2400-3000 (It)
Commercial costs:
3800 (US); 2900-3800 (Jp)
16-38 (Europe)
21-44 (OECD)
28-55 (non-OECD)
Solar PV
Ground mounted
utility-scale
Peak capacity; 2.5-250 MW
Capacity factor: 10-25% (fixed tilt)
Conversion efficiency: 10-30% (high end is CPV)
1200-1950 (typical global);
3800 (Jp); 2000 (US); 1710 (Cn); 1450 (De); 1510 (In)
14-34 (Europe)
12-38 (OECD)
9-40 (non-OECD)
CSR
50-250 MW (trough)
20-250 MW (tower)
10-100 MW (Fresnel)
Capacity factor;
20-40% (no storage)
35-75% (with storage)
Trough, no storage;
4000-7300 (OECD)
3100-4050 (non-OECD)
Trough, 6hr storage;
7100-9800
Tower: 5600 (US, no storage); 9000 (US, with storage)
Trough & Fresnel;
19-38 (no storage)
17-37 (6hr storage)
Tower:
12.5-16.4 (US)
Wind
Onshore
1.5-3.5 MW
Capacity factor: 25-40%
925-1470 (Cn/In)
1500-1950 (elsewhere)
4-16 (OECD)
4-16 (non-OECD)
Wind
Offshore
1.5-7.5 MW
Capacity factor: 35-45%
4500-5500
15-23
Wind
Small-scale
<100 kW
6040 (US); 1900 (Cn)
15-20 (US)
Bio Power
solid biomass
1-200 MW
Conversion efficiency: 25-35%
Capacity factor: 50-90%
800-4500
Co-fire: 200-800
4-20
Co-fire: 4-12
Bio Power
gasification
1-40 MW
Conversion efficiency: 30-40%
Capacity factor: 40-80%
2050-5500
6-24
Bio Power
anaerobic digestion
1-20 MW
Conversion efficiency: 25-40%
Capacity factor: 50-90%
Biogas: 500-6500
Landfill gas: 1900-2200
Biogas: 6-19
Landfill gas: 4-6.5
Geothermal Power
1-100 MW
Capacity factor: 60-90%
Condensing flash: 1900-3800
Binary: 2250-5500
Condensing flash: 5-13
Binary: 7-14
Ocean Power
Tidal range
1-250 MW
Capacity factor: 23-29%
5290-5870
21-28
>Top 2. Wind Power Energy:
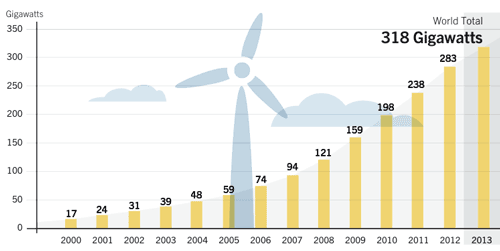
- Wind Power Global World Capacity, 2000-2013:
- Wind Power Capacity & Additions, Top 10 Countries, 2013
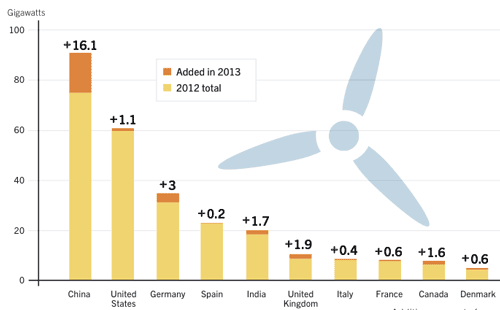
- 71 countries have more than 10 MW.
- 24 countries have more than 1 GW installed.
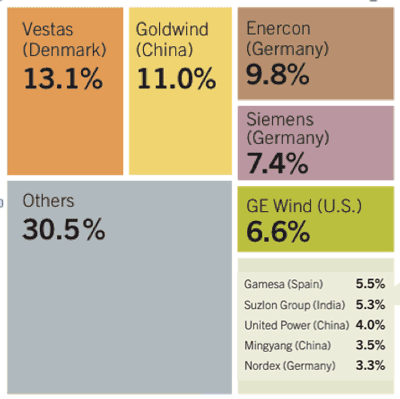
- Market Shares of Top 10 Wind Turbine manufacturers, 2013:
- Market Trend:
- Capital costs of wind power have declined, through technological advance including taller towers, longer blades, and smaller generators in low wind speed areas have increase capacity factors.
- These developments improved its cost competitiveness relative to fossil fuels.
- Onshore wind-generated power is now cost competitive on a per kWh basis with new coal or gas-fired plants, even without compensatory support schemes.
- European turbine makers experienced a decline in market share within China, where domestic suppliers over 93% in 2013.
- Grid-related challenges are increasing and range from lack of transmission infrastructure, to delays in grid connection, to rerouting of electricity through neighboring countries.
2. 風力エネルギー:
- 世界の風力発電容量 (2000-2013): GW
- 風力エネルギー先進10ヶ国
- 中国
- 米国
- ドイツ
- スペイン
- インド
- 英国
- イタリー
- フランス
- カナダ
- デンマーク
- 日本はどうした?!
- 風力タービンエンジンメーカー;上位10社
- Vestas (デンマーク)
- Goldwind (中国)
- Enercon (ドイツ)
- Siemens (ドイツ)
- GE Wind (米国)
- Gamesa (スペイン)
- Suzion Group (インド)
- United Power (中国)
- Mingyang (中国)
- Nordex (ドイツ)
- 日本メーカはどうした?!
>Top 3. Solar PV (Photovoltaic) Energy:
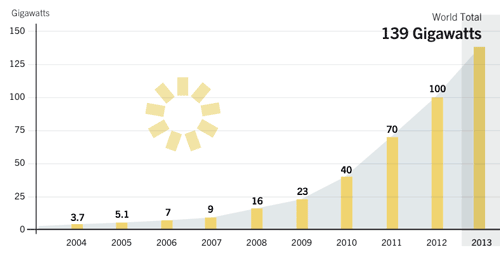
- Solar PV Total Global Capacity, 2004-2013:
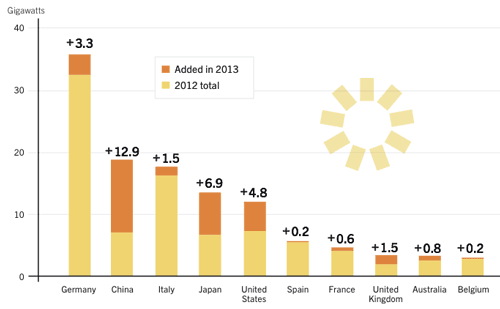
- Solar PV Capacity & Additions, Top 10 Countries, 2013:
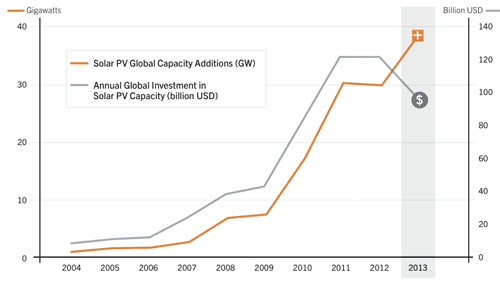
- Solar PV Global Capacity Additions & Annual Investment, 2004-2013:
- Market trend:
- Global sola PV market had a record year, installing more capacity than any other renewable technology.
- More than 39 GW was added, bring total capacity to 139 GW.
- Major shift geographically as China, Japan, and US became top three installers.
- China's spectacular growth offset Europe's significant market decline.
- Much of China's capacity is concentrated in sunny western provinces far from load centers and consists of very large-scale projects.
- Japan saw a ruch to install capacity in response to its FIT, adding 6.9 GW in 2013 for a total of 13.6 GW.
- Market cosolidation among manufactureres continued in 2013 , with M&A activity reaching reacord levels mid-year, and bankruptcies and closure continuing.
3. 太陽光発電 (PV)エネルギー::
- 太陽光発電(PV)容量 2004-2013
- 139 GW/2013
- 太陽光発電(PV)上位10ヶ国 2013:
- ドイツ
- 中国
- イタリー
- 日本
- 米国
- スペイン
- フランス
- 英国
- 豪州
- ベルギー
- 日本はFITの効果大で4位
- 太陽光発電(PV)への投資推移 2004-2013
>Top
4. Solar Water Heating:
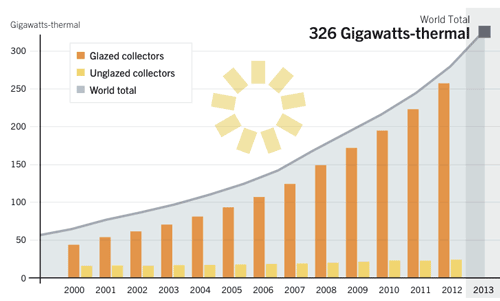
- Solar Water Heating Collectors Global Capacity, 2000-2013:
4. 太陽熱給湯:
- 太陽熱給湯容量 2000-2013:
>Top
5. Hydropower:
- Hydropower Capacity & Additions, Top Six Countries, 2013:
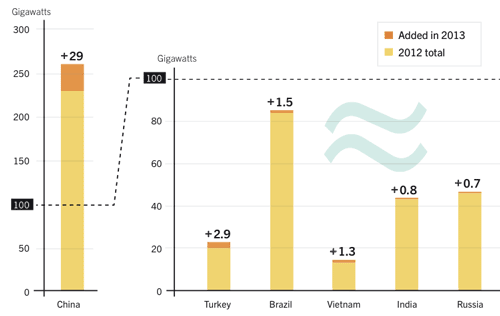
- Global Hydropower capacity reacheds 1,000 GW:
- despite a significant jump in new capacity in 2013, the intake of new orders for some major companies declined relative to 2012.
5. 水力発電:
- 水力発電容量上位6ヶ国 2013
>Top 6. Jobs in Renewable Energy:
- Jobs in Renewable Energy Worldwide, by Industry: K jobs 2013-2013; Data source IRENA
World
China
Brazil
US
India
Bangla.
Germany
Spain
Oth. EU
Solar PV
2273
1580*
112
100
56
11
153
Biofuels
1453
24
820*
236*
35
26
3
82
Wind Power
834
356
32
51
48
0.1
138
24
166
Biomass*
782
240
152
58
52
44
210
Solar Heat
503
350
30*
41
11
1
31
Biogas
264
90
85
9.2
49
0.5
19
Geothermal
184
35
17
1.4
82
Hydropower
(small)*
156
12
8
12
4.7
13
1.5
18
CSP
43
143*
1
28
0
Total
6492
2640
894
625
391
114
371
114
760
- Data: principally for 2012-2013, with dates varying by country and technology. Some data for India and China are older. Totals may not add up due to rounding.
- Biomass: Traditional biomass is not included.
- Hydropower: Employment information for large-scale hydropower is incomplete; focusses on small hydro (<10MW)
- Solar PV: installation jobs have expanded massively.
- Biofuels (Brazil): 331K jobs in sugar cane, 208K in ethanol processing, 200K indirect jobs in equipment manufacturing, and 82K in biodiesel.
- Biofuels (US): includes 134K jobs for ethanol and 62K jobs for biodiesel.
- Solar Heat: equipment manufacturing, installation jobs not included.
- CSP: All solar technologies combined, with solar PV close to 100K.
6. 再生可能エネルギー関連雇用:
- 再生可能エネルギーによる
雇用機会
- 世界で650万人の雇用に貢献
- その内40%は中国
- 建設時の波及効果はさらに大
Comment
- Latest statistics of Energy Industries had not been clearly opened; but REN21 clarified the data of Renewable Energy as much as possible.
- Reliable data would contribute affirmative impact of promoting Renewable Energy.
- エネルギー業界の最新の統計データはなかなか明示されてこなかったが、REN21は再生可能エネルギーのデータを極力明示している。
- 信頼できるデータは再生可能エネルギーの推進に貢献することになろう。
Renewables |
Cat: ENE |
|
Renewable Energy Policy Network for 21st Century |
UP 14911 |
Titile |
Summary of REN21 Report 2014 |
REN21再生可能エネルギー報告2014 |
|---|---|---|
Why |
|
|
Résumé |
Remarks |
|||||||||||||||||||||||||||||||||||||||||||||||||||||||||||||||||||||||||||||||||||||||||||||||||||||||||||||||
>Top 0. Executive Summary:
|
0. 概要:
|
|||||||||||||||||||||||||||||||||||||||||||||||||||||||||||||||||||||||||||||||||||||||||||||||||||||||||||||||
>Top 1. Economics of Renewable Energy: (再生可能エネルギーの経済)
|
||||||||||||||||||||||||||||||||||||||||||||||||||||||||||||||||||||||||||||||||||||||||||||||||||||||||||||||||
>Top 2. Wind Power Energy:
|
2. 風力エネルギー:
|
|||||||||||||||||||||||||||||||||||||||||||||||||||||||||||||||||||||||||||||||||||||||||||||||||||||||||||||||
>Top 3. Solar PV (Photovoltaic) Energy:
|
3. 太陽光発電 (PV)エネルギー::
|
|||||||||||||||||||||||||||||||||||||||||||||||||||||||||||||||||||||||||||||||||||||||||||||||||||||||||||||||
>Top
|
4. 太陽熱給湯:
|
|||||||||||||||||||||||||||||||||||||||||||||||||||||||||||||||||||||||||||||||||||||||||||||||||||||||||||||||
>Top
|
5. 水力発電:
|
|||||||||||||||||||||||||||||||||||||||||||||||||||||||||||||||||||||||||||||||||||||||||||||||||||||||||||||||
>Top 6. Jobs in Renewable Energy:
|
6. 再生可能エネルギー関連雇用:
|
|||||||||||||||||||||||||||||||||||||||||||||||||||||||||||||||||||||||||||||||||||||||||||||||||||||||||||||||
Comment |
|
|