Presentation
|
Message
|
>Top 0. Introduction:
- There are several points of controversy related to the famous debate of "Has IT raised productivity?" :
- Impact of price down of IT related goods
- Impact of software
- Importance of intellectual labor
- Network externality
- Lead time until increase of productivity
|
0.
序:
- 「ITが生産性をあげたか」という生産性論争に関連する論点には以下がある。
- IT財の価格低下のインパクト
- ソフトウェアのインパクト
- 知的労働の重要性
- ネットワークの外部性
- 生産性向上までのリードタイム
|
>Top 1. A way to Information Economy:
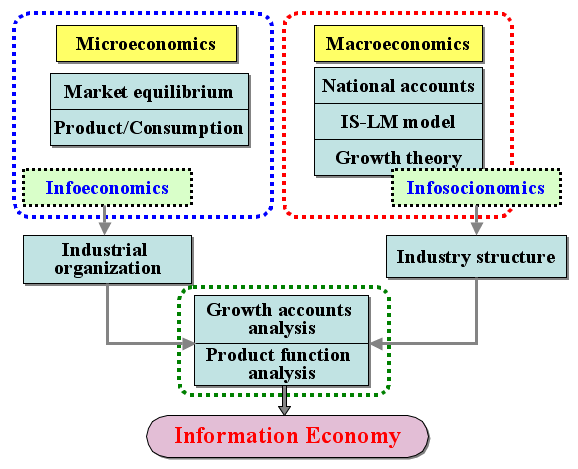
- One viewpoint from microeconomics: >Fig.
- Market equilibrium:
- -> Infoeconomics -> Industrial organization -> Productivity by IT utilization
- >Top Another viewpoint from macroeconomics:
- National accounts:
- -> Investment/Saving equilibrium, & Liquidity preference/Money supply equilibrium (IS/LM model) -> Growth theory -> Industry structure theory
-> Informatization of industry or industrialization of information
- Productivity = IT + Organization (review of workflow)
- Integrating the above, growth accounting analysis and production function analysis -> Information Economy (new)
- Information Economy unit in OECD
|
1.情報経済学への道のり:
- 1つの流れ:
ミクロ経済学の市場均衡論
- →情報経済学
- →さらに産業組織論で、IT導入による生産性
- もう一つの流れ:
マクロ経済学のIS-LM分析
- →成長論
- →産業組織論
産業の情報化、情報の産業化
- これらが統合:
成長会計分析や生産関する分析や新たな情報経済学へ
- Macroexonomics & Microeconomics: (Fig.)
 |
>Top 2. Solow's Productivity Paradox:
- "We cans see the computer age everywhere but in the productivity statistics." - Robert Solow, a Nobel laureate economist - NY Times, July 12, 1987
- "You can now see computers in the productivity statistics" R. Solow - NY Times, Mar 12, 2000
- "Productivity isn't everything, but in the long run it is almost everything." - Paul Krugman, The Age of Diminished Expectations -1990
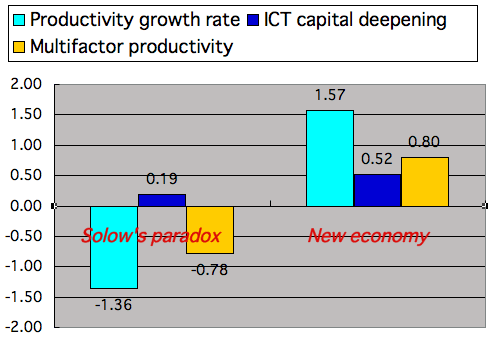
- ICT in the productivity statistics: >Fig.
- Period of Solow's paradox:
from: 1959-1973
to: 1973-1995
- Period of New economy:
from: 1973-1995
to: 1995-2003
- >Top TFP (Total Factors Productivity):
- Labor Productivity (output per hour):
Output / labor Inputs
- Capital deepening ratio: (also called Capital equipment ratio)
capital per worker is increasing; measured by capital stock per labor hour.
- Multifactor productivity (MFP):
changes in output per unit of combined inputs.
|
2. ソローのパラドックス:
- ITによる生産性の向上は統計には現れていない。(NY Times, 1987)
- ようやく統計上に現れた(NY Times, 2000)
-----
- 労働生産性
- IT資本の深化=資本投入率/労働時間
- 全要素生産性=
資本生産性+労働生産性など
- IT Productivity Statistics: (Fig.)
 |
>Top 3. Economic growth in less population:
- Working Age Population:
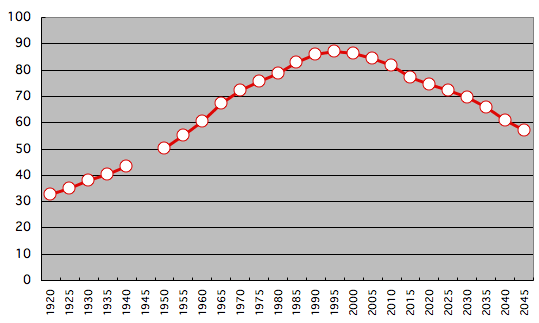
Population of working people in Japan (15-64): 
- GDP = Productivity x Population
- Differentiation of logarithm of both sides:
q = P + n
- where, q= economic growth, p= productivity growth, n= population growth
- Productivity growth = Multifactor growth + Capital deepening
- Growth rate = Demographic factor+ Productivity factor
= Labor input + Total factor productivity + Capital goods deepening + IT capital deepening + Economic cycle
|
3.
人口減少下の経済成長:
- 生産年齢人口 (15-64)の推移: Fig.
- 経済成長率=生産性上昇率+人口増加率
- 生産性上昇率=全要素生産性変化率+資本深化変化率
------------
- 成長率=
人口動態要因 (労働投入) +
生産性要因 (全要素生産性+一般資本深化+情報資本深化+景気循環)
|
>Top 4.
Factors of economic growth:
- Production function is:
- (1) Q = M・ Ko^α・Ki^β・(hrL)^γ
- where, Q = added value (=Output) , M = multifactor productivity, Ko = non-IT assets, Ki = IT assets, hr = working hours per employee, L = number of employees
- α, β, and γ represent income shares; α+β+γ=1
- Logarithmic deferentiation of the above (1) equation will be:
- (2) dQ - hdrL = dM + α(dKo - hdrL ) +β(dKi - hdrL)
- dQ - hdrL means rate of change (RC) of labor productivity
- dM means RC of multifactor growth
- α(dKo - hdrL) means RC of general capital deepening
- β(dKi - hdrL) means RC of information capital deepening
- As economic cycle, capacity utilization ratio is considered:
- (3) Q = M・ (pKo)^α・(pKi)β・(hrL)^γ
- where, p = capacity utilization ration (= utilization rate of assets
- Similarly from the (1) and (2):
- (4) dQ - hdrL = dM + α(dKo - hdrL ) +β(dKi - hdrL) + (α+β)dp
- (α+β)dp means economic cycle (=RC of capacity utilization ratio)
|
4. 経済成長の要因:
- 付加価値の変化(dQ)
:対数微分をとる。
- (4)式は
労働生産性の変化率
=全要素生産性の変化率要因
+一般資本整備率の変化率要因
+情報資本装備率の変化要因
+稼働率変化要因
の4要因に分解できる。
|


