 |
Cross Chart Analysisfrom : Practical Balanced Scorecard
|
Cat: EC0 |
Kazuo Matsui |
07320u/18123r |
Index
Why?
- Financial analysis, Balanced Scorecard, and PPM are respectively
important but boring to study.
- But if all these factors are plotted and analyzed on quadrant
chart, it becomes suddenly interesting.
- This is the essence of a book named 'Practical Balanced Scorecard
using 21 charts.'
- 財務分析、バランススコアカード、プロダクト・ポートフォリオ・マネジメントはそれぞれ重要だが、勉強するには退屈である。
- しかしもしこれらの要素が4象限の図にプロットされ分析されることになれば、俄然おもしろくなる。
- これは「21チャートを活用した実践バランス・スコアカード」の本のエッセンスである。
Key
Phrase
キーフレーズ
>Top
1. ROE (Return on Equity):
- ROE will equal net margin multiplied by Asset
Turnover multiplied by Financial Leverage:

- ROE =
EPS / BPS
- ROE = Rate of Return On Equity
- EPS = Earnings Per Share
- BPS = Book-value Per Share
1.
自己資本利益率:
- ROE = 当期純利益/当期株主資本
- ROE = 一株当たり利益率(EPS)/一株当たり純資産(BPS)
- ROEの向上:
- 売上高利益率の向上:収益性
利益率の高い商品の開発
- 総資産回転率の向上:効率性
売上高の慎重。遊休資産の売却。
- 財務レバレッジの向上:財務安定性
負債の利用割合の増加
>Top 2. PPM Analysis:
- PPM (Product Portfolio Management):
- Boston Consulting developed this Matrix,
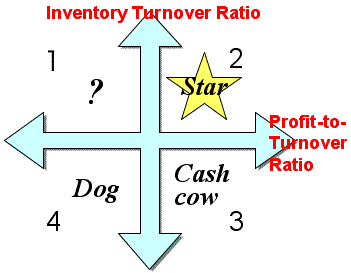 positioning products
in each quadrant.
- X-axis: Market share
- Y-axis: Market growth rate
- 1st quadrant: Question mark
- 2nd quadrant: Star
- 3rd quadrant: Cash cow
- 4th quadrant: Dog
- PPM describes a strategy that investing the money gained
from 'Cash Cow' to 'Question Mark' or 'Dog' to cultivate them
to the next Star products.
- 4P of marketing mix:
- Product: quality and feature
- Price:
- Place: sales channel
- Promotion: sales promotion
2.
PPM分析:
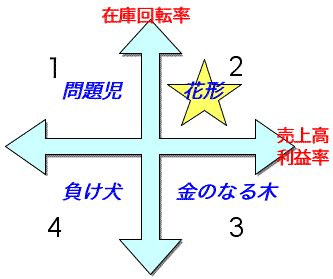
- プロダクト・ポートフォリオ・マネジメント
- X軸:市場シェア
- Y軸:市場成長率
- 第1象限:問題児
- 第2象限:花形商品
- 第3象限:金のなる木
- 第4象限:負け犬
- PPMは、金のなる木から得られた資金を問題児または負け犬に投資して、次の花形商品を育成する戦略を述べている。
>Top 3. Life Cycle of
Products:
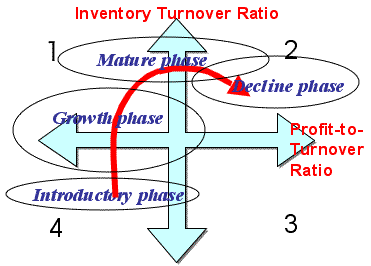
- Life Cycle of products: (Above figure)
- Priority of strategic target: (Right figure)
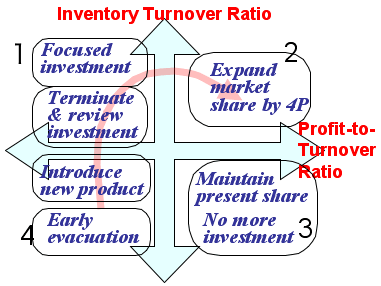
- Segmented strategy in each quadrant:
3.
製品のライフサイクル:
- 商品ライフサイクル(左図):
- 戦略ターゲットの優先順位(下図):
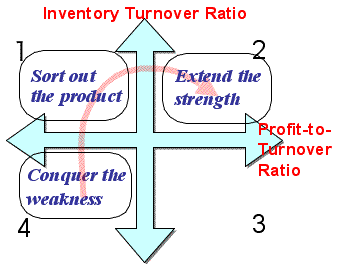
- 象限別の戦略(左図):
- 第1象限:
- 積極重点投資
- 投資を中断。撤退時期を判断
- 第2象限:
- 4Pによる市場シェア拡大戦略
- 第3象限:
- 現状シェアの維持
- 投資凍結
回収利益を第1/2象限に投資
- 第4象限:
- 新製品の導入期
- 早期に撤退時期を検討
>Top 4. Strategy-21
Chart:
#
BSC
Analysis name
Unit
X-axis
Y-axis
Analysis descrip.
1
Finance
ROI/ROE analysis
Corp.
Current profit/Sales
Cap turnover
ROI/ROE
2
PPM analysis
Product
Market share
Market growth
Sales by product
3
Profit contribution
by product
Product
Profit to Sales
Inventory turnover
Sales % distribution
4
Target cost
Process
Cost analysis
Target cost
Labor cost by process
5
Product value-added
analysis
Product
Production value
Inventory of finished
goods
External purchase value
by product
6
Customer
Profit contribution by customer
Cust.
Profit to Sales
Sales growth
Sales % distribution
7
CS analysis
Cust.
Sales growth
# of claims
# of sales staff by cust.
8
Sales opportunity loss
Product
Inventory volume
Sales amount
# of shipment by cust.
9
Sales efficiency
Cust.
# of estimate
# of quotation
# of contract by cust.
10
Collect. of sales amount
Cust.
Collet. ratio of receivable
Sales growth
Sales by customer
11
Process
Contribu. by IT implementation
Div.
# of staff
PC equipage
Admin. cost by div.
12
Ord. process by purchase
Parts
Code price
Lead time
Prime cost %
13
Ord. lot analysis
Product
# of order per month
Inventory amount
Prime cost per each
14
Throughput analysis
Product
Yield ratio
Capacity usage
Productivity
15
Logistics analysis
Product
Procure. lead time
Inventory turnover
Logistics cost by prod.
16
ABC analysis
Product
Marginal profit ratio
Sales amount
Overhead cost by prod.
17
HR
MBO analysis
Person
Achievement. ratio
Target growth
Sales % by person
18
Sales activity
Person
Profit ratio
Sales growth
Sales % by person
19
Added value
Product
Labor share
Sales amount
Added value by prod.
20
Assessment
Person
Assessment by boss
Assessment diff.
Contribution degree
21
Personal assignment
Div.
Added value amount
Sales amount
# of staff by org.
4. 戦略21チャート:
#
分類
分析名称
分析単位
X軸
Y軸
分析名称
1
財務
ROI/ROE分析
企業
売上高経常利益率
総資本回転率
ROI/ROE
2
PPM分析
製品
市場シェア
市場成長率
製品別売上高
3
製品別利益貢献度
製品
売上高粗利益率
在庫回転率
売上高構成比
4
目標原価進捗
工程
原価進捗分析
目標原価
工程別人件費
5
生産付加価値分析
製品
生産額
製品在庫高
製品別外部購入価値
6
顧客
顧客別利益貢献度
顧客
売上高粗利益率
売上高伸び率
売上高構成比
7
CS分析
顧客
売上高伸び率
クレーム件数
顧客別営業要員数
8
販売機会損失
製品
在庫高
売上高
製品別出荷ロット数
9
営業効率分析
顧客
見積件数
引合件数
顧客別成約件数
10
販売回収分析
顧客
売掛債権回収率
売上高伸び率
顧客別売上高
11
業務
IT導入貢献度
部門
従業員数
PC装備率
部門別管理費
12
仕入品目別発注手続
部品
仕入原価
リードタイム
仕入高構成比
13
経済発注ロット分析
製品
月間発注回数
在庫高
1回当り仕入高
14
工場スループット分析
製品
歩留
稼働率
生産性
15
物流コスト分析
製品
調達リードタイム
在庫回転率
製品別物流費
16
ABC原価
製品
限界利益率
売上高
製品別製造間接費
17
育成
目標管理考課分析
個人
目標達成率
目標伸び率
担当別売上高構成
18
営業行動分析
個人
粗利益率
売上高伸び率
担当別売上高構成
19
付加価値分析
製品
労働分配率
売上高
製品別付加価値額
20
考課差異分析
個人
上司による考課
考課差異
貢献度
21
要員配置分析
部門
付加価値額
売上高
部門別社員数
>Top 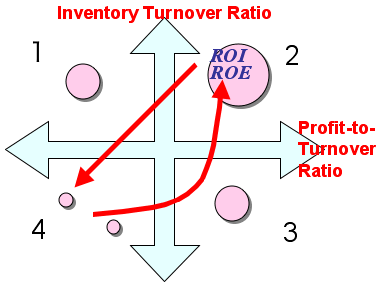 5. Growth & decline
of ROI/ROE:
- When ROI/ROE increases, it tends to shift from 4 to 3, then to
2 quadrant
- While ROI/ROE decreases, it tends to shift from 2 to 4 directly.
5.
ROI/ROEの成長と衰退:
- ROIとROEが増大するときは、4象限から3象限、そして2象限への移動する傾向がある。
- ROIとROEが減少するときは、2象限から4象限へ直接移動する傾向がある。
>Top 6. Strategy
by each quadrant:
- 1st Quadrant:
- Low profit-to-sales ratio, but high growth of sales.
- Gross profit ratio should be improved, and sales cost be
decreased.
- Lower profit ratio could cause shortage of funding.
- To aim shore expansion by cooperating in political price
only during limited term or in a certain area.
- 2nd Quadrant:
- Both profit-to-sales ratio and growth of sales are high.
This quadrant has golden customers.
- To secure sales from customers by focusing management
resources such as sales persons, sales promotion expenses,
and inventory.
- But if the number of customers are small compared to the
amount of sales, there would be 'sales risk.' Development of
more customers is needed to disperse such risk.
- 80% of sales by less than 20% customers: badly
polarized
- 80% of sales by more than 40% customers: should have
major customer
- 3rd Quadrant:
- High profit-to-sales ratio, but low growth of sales.
- Active marketing strategy by injecting sales promotion expenses
using the profit from this quadrant.
- It is necessary to assess whether customers really grow or
not.
- Growth of customer's economic situation and share ratio of
the customer is important criterion.
- 4th Quadrant:
- Both profit-to-sales ratio and growth of sales are low.
- It is strategically important to review the transaction itself.
- Generally,
the transaction with less than
15% margin should be reviewed, which could not sustain the
overhead.
- If the marginal profit ratio is not zero, price proposal
according to the sales ranking is needed.
- But political pricing to the initial customers could be possible
to induce them to the 1st quadrant customer.
6. 象限別戦略:
- 第1象限:
- 売上高利益率は低いが、売上高伸び率が高い
- 粗利益率改善、販売コストの削減
- 粗利益率が低いと長期的には資金ショートの原因になる。
- 期間あるいは地域を限定して政策的価格協力することでシェア拡大を目指す
- 第2象限:
- 売上高利益率も売上高伸び率も高い。上得意のドル箱顧客である。
- 経営資源 (営業マン、販促費、在庫)の集中投入によって得意先で売上を確保する。
- 顧客数が少なく、かつ売上高構成比が大きい場合は、顧客の経営状況による影響度が高増(販売リスク)。リスク分散のために複数顧客の開拓が課題。
- 売上高80%が20%以下の顧客数で実演している場合は、偏りすぎである。
- 売上高80%が40%以上の顧客で実現されていれば、柱になる大口先を育てるべきである。
- 第3象限:
- 売上高利益率は高いが、売上高伸び率が低い。
- 粗利益を原資として販促費の投入による積極的なマーケティング戦略が必要。
- 今後伸びる顧客かを見極めることが必要。
- 顧客の業績伸張状況とその顧客の売上高構成比をもって判断する。
- 第4象限:
- 売上高利益率も売上高伸び率も低い。
- 戦略のポイントは取引自体の見直しである。
- 一般的には販売管理費は15%以上必要なので、粗利益率が15%以下の場合は取引の見直しが必要になる。
- 限界利益分析を行う。限界利益がゼロでなければ、取引高ランクに怖じた価格提示をする。
- 取引初期の顧客は政策的価格を提示して第一象限へのアプローチを行う。
>Top 7. Activity-Based
Costing Analysis:
- Activity-Based Costing is a tool for strategic cost management,
which was proposed by Prof. Robert Kaplan (proponent of Balanced
Scorecard) published in 1991.
- During mid 1980s US manufacturers needed to analyze real
cost drivers which deteriorate their competitiveness.
- Now various support cost and service cost are increasing
to maintain business activities and product management. Such
costs are decreasing direct cost but increasing indirect cost.
- Conventional cost accounting allocates according to operating
rate of equipment, which became inaccurate, because indirect
costs were not caused equally by all the products.
- But ABC
seeks to identify areas of high overhead costs per unit and
charge more for costly products.
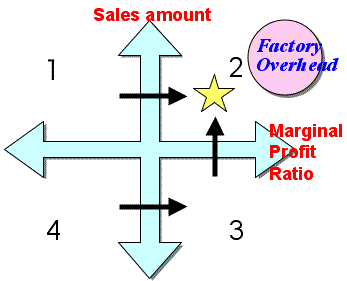
- ABC Analysis:
1st quadrant:
- Reduce variable cost (=direct cost) of goods purchased, and
raise the marginal profit ratio..
- 2nd quadrant:
- Best positioned products, but the market share is important.
- If its share is high, promote differentiation strategy by sales price, product features, sales channel, delivery conditions,
etc.
- If its share is low, promote centralization strategy by limiting
sales area, product items, customers (end-usage), etc.
- In case of Web market, target to niche market or maniac
market.
- 3rd quadrant:
- High marginal profit ratio products; develop active sales
promotions taking advantage of high profitability.
- Unless further sales expansion could be expected, promote
more cost-cutting, improving gross profitability.
- 4th quadrant:
- Level of the marginal profit ratio is important criterion;
check whether the product falls into deficit; give clear priorities
on further cost-cutting of variable cost such as goods purchased.
7. ABC原価分析:
- これは1991年にバランススコアカードで有名なRobert Kaplan教授が提唱。
- 1980年代に米国のメーカは、競争力低下に対応してコスト要因の分析に迫られていた。
- 現在は様々なサポートやサービスコストがビジネス活動や生産管理の維持のために増加してきている。これらのコストは直接費は減少しているものの間接費は増えている。
- 設備の稼働率によって賦課する従来のコスト会計では、正確でなく、また間接費はすべての製品にとって均一でもない。
- しかしABCは、単位当たりオーバーヘッドコストの高い分野を特定し、より多く賦課することを目指している。
- ABC原価分析(左図):
- 第1象限:
- 仕入品等の変動費(直接原価) を削減して、限界利益率を高める。
- 第2象限:
- ベストポジションの製品群だが、市場シェアが重要である。
- 高シェアであれば、販売価格や製品機能、流通経路、納入条件等で差別化戦略をとる。
- 低シェアであれば、地域特定、製品特定、顧客 (用途)特定 など集中化戦略をとる。
- Web通販の場合は、ニッチ市場やマニア市場に集中する。
- 第3象限:
- 限界利益率が高い製品群なので、高収益性を武器に積極的な販売促進戦略を展開する。
- 市場環境から売上拡大が期待できない場合は、製品間接費のコストダウンを進め、さらに粗利益を改善する。
- 第4象限:
- 限界利益率の程度が重要な判断基準である。当該商品が赤字になっていなかチェックし、さらなる仕入れ品等の変動費のコストダウンを図る。
Marginal profit ratio:
- Sales - Variable cost - Fixed cost = Profit
- (Sales - Variable cost) = Marginal profit
- Marginal profit = Fixed cost + Profit
- Break Even Point (BEP) = Fixed cost (F) / Marginal Profit ratio
(m)
- If you consider Profit (P), calculate BEP adding Fixed cost
plus Profit.
- Sale = (F + P)/m
- mPQ = F
Sale (= Price x Quantity) x m% = Fixed cost (F)
限界利益率:
- 売上ー変動費ー固定費=利益
- (売上ー変動費)=限界利益
- 限界利益=固定費+利益
- 損益分岐点(BEP) = 固定費(F)/限界利益率(m)
- 利益Pを出す場合、固定費を利益分だけ上乗せして損益分岐点を計算する。
- 売上高 = (F + P ) / m
- mPQ = F
売上(価格P x 量Q)のm%は、固定費(F)に等しい。
Comment
- The essence of business is very simple: does it sells well, or
is it profitable?
- The former approached more plus of Y-axis, the latter approached
more plus of X-axis in the above quadrant chart.
- 商売の本質は非常に単純である。よく売れているか、またはよく儲かっているかである。
- 前者は上記4象限の図のY軸のプラス方向に位置づけられ、後者はX軸のプラス方向に位置づけられるというのである。
Index |
||
Why? |
|
|
Key Phrase |
キーフレーズ |
>Top 1. ROE (Return on Equity):
|
1. 自己資本利益率:
|
>Top 2. PPM Analysis:
|
2. PPM分析:
|
>Top 3. Life Cycle of Products:
|
3. 製品のライフサイクル:
|
>Top 4. Strategy-21 Chart:
|
|||||||||||||||||||||||||||||||||||||||||||||||||||||||||||||||||||||||||||||||||||||||||||||||||||||||||||||||||||||||||||||||||||||||||
4. 戦略21チャート:
|
>Top
|
5. ROI/ROEの成長と衰退:
|
>Top 6. Strategy by each quadrant:
|
6. 象限別戦略:
|
>Top 7. Activity-Based Costing Analysis:
|
7. ABC原価分析:
|
Marginal profit ratio:
|
限界利益率:
|
Comment |
|
|